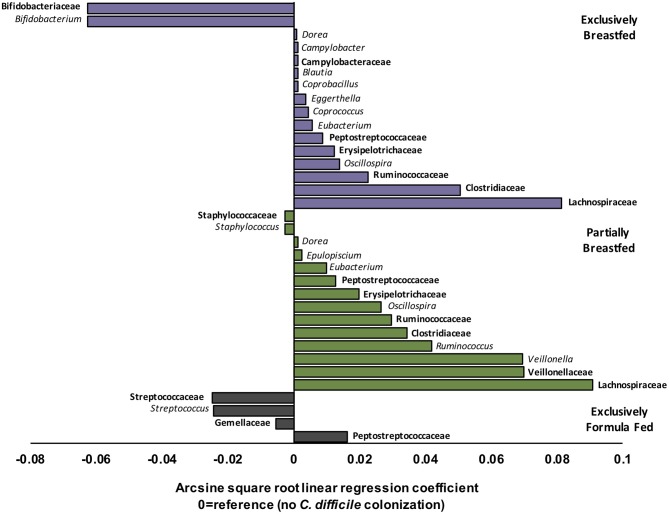
Figure 2.
Relative differences in microbiota composition between C. difficile carriers and non-carriers across infant feeding groups (n = 1,554). Multivariate linear regression results (MaAslin) for family (bolded) and genus level taxa that are differentially associated with C. difficile colonization at 3–4 months of age. Values on the x-axis represent arcsine square root transformed regression coefficients of microbiota relative abundances for each linear model, adjusted for multiple comparisons (FDR correction) to determine which taxa are uniquely associated with C. difficile colonization. Each model had a reference of infants without C. difficile colonization at 3–4 months. Data shown only for taxa with FDR corrected two-sided q-value < 0.05. Coefficients > 0 (positive values) represent taxa that enriched in C. difficile carriers, while coefficients < 0 (negative values) represent taxa that were depleted in C. difficile carriers. P-values for each regression can be found in Supplementary Tables 3–5. Purple represents EBF (N = 853, 193 CD+), green for PBF (N = 431, 155 CD+) and gray for EFF (N = 270, 134 CD+).

