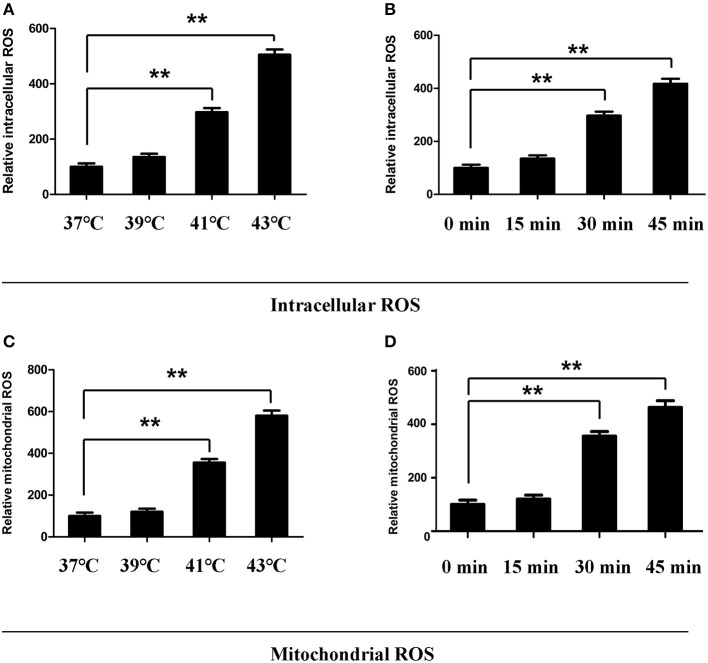
Figure 7.
Effect of heat stress on intracellular reactive oxygen species (ROS) and mitochondrial ROS. (A,C) Cells were incubated at different temperatures (37, 39, 41, and 43°C) for 45 min. (B,D) Cells were subjected to heat stress (43°C) for different times (0, 15, 30, and 45 min). Intracellular ROS were analyzed in (A,B). Mitochondrial ROS were analyzed in (C,D). Levels of intracellular ROS and mitochondrial ROS are shown in the bar graph. Values are mean ± SD for six independent experiments. **p < 0.01 compared with the control group (37°C) (A,C) or sham heated group (B,D).

