
Figure 1.
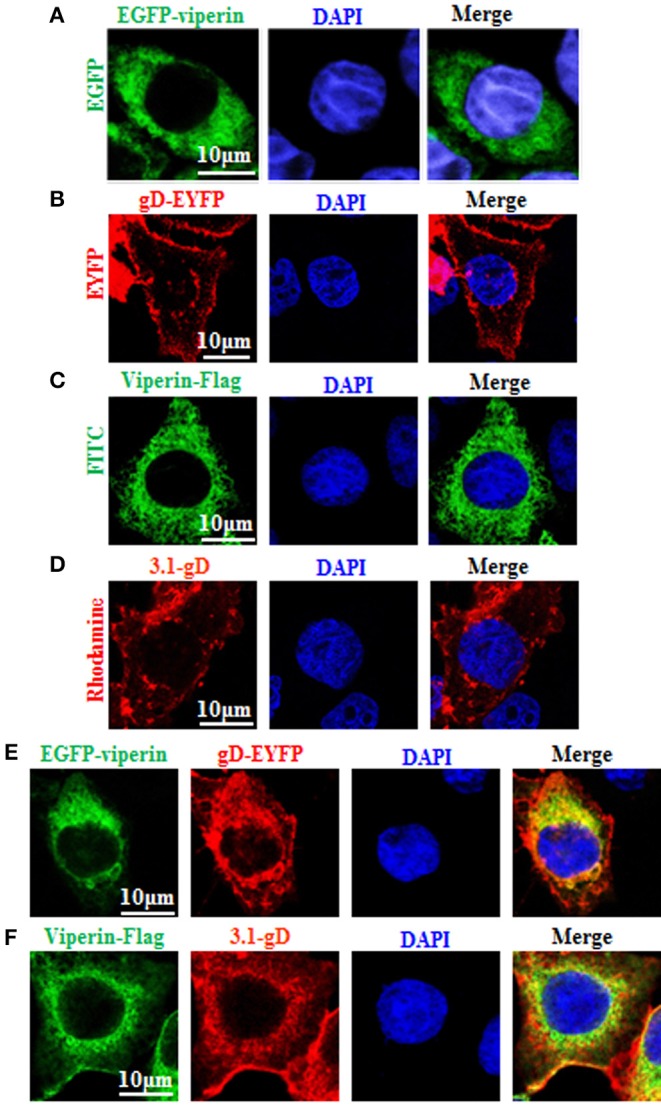
Co-localization of gD with viperin. (A,B) Subcellular localization of viperin and gD in live cells. COS-7 cells were transiently transfected with EGFP-viperin (A) or gD-EYFP (B) expression plasmid. Fluorescence image of EGFP-viperin fusion protein was presented in its original color green, and gD-EYFP fusion protein was presented in pseudo-color red. (C,D) Subcellular localization of viperin and gD in chemically fixation cells. Viperin-Flag (C) or 3.1-gD (D) expression plasmid was transfected into COS-7 cells, then IFA was performed with primary antibody mouse anti-Flag mAb or rabbit anti-gD pAb, and secondary antibody FITC-conjugated goat anti-mouse IgG or TRITC-conjugated goat anti-rabbit IgG, respectively. Fluorescence images of FITC-conjugated protein and TRITC-conjugated protein were presented in their original colors green and red, respectively. (E) Co-expression of EGFP-viperin and gD-EYFP in live cells. COS-7 cells were co-transfected with EGFP-viperin and gD-EYFP expression plasmids. Fluorescence images of fusion proteins were presented as indicated in (A), and yellow color shows the co-localization of colors merged with green and red. (F) IFA analysis of COS-7 cells co-expressed with Viperin-Flag and 3.1-gD, with primary antibodies mouse anti-Flag mAb and rabbit anti-gD pAb, and secondary antibodies FITC-conjugated goat anti-mouse IgG and TRITC-conjugated goat anti-rabbit IgG. Twenty-four hours post-transfection, all the cells were stained with DAPI (blue) for 5 min, and analyzed with confocal microscopy. All of the photomicrographs were taken at a magnification of 600×. Each fluorescence image was representative of the vast majority of the cells observed. All scale bars indicate 10 um.