FIGURE 2.

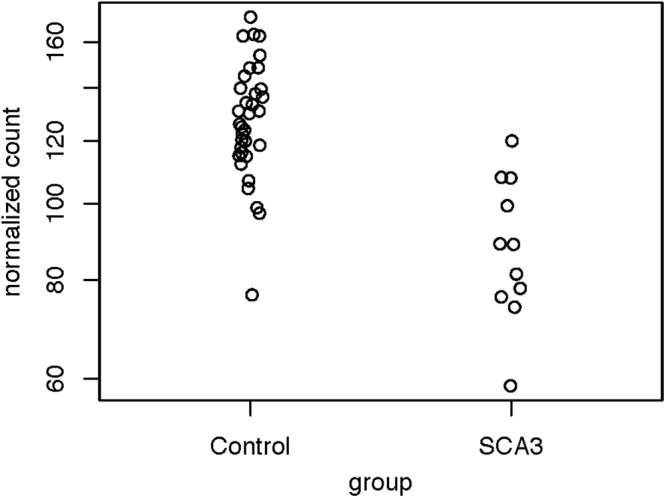
Distribution of normalized read counts of the SCA3 loci. The read counts of the controls and the patients with SCA3 were compared using the Wald test (P = 1.47e-05, FDR = 4.42e-05).

Distribution of normalized read counts of the SCA3 loci. The read counts of the controls and the patients with SCA3 were compared using the Wald test (P = 1.47e-05, FDR = 4.42e-05).