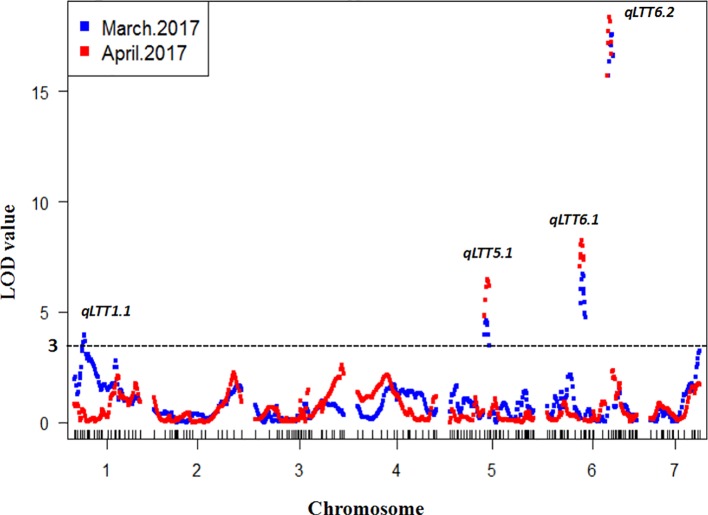
Figure 3.
Quantitative trait locus (QTL) analysis of low temperature tolerance in cucumber seedlings. Blue squares indicates the first treatment and red square indicates the second treatment. The x-axis indicates the genetic position of each chromosome, the y-axis indicates the logarithm of the odds value. Four QTLs were detected in two experiments and three QTLs were repeatedly identified.

