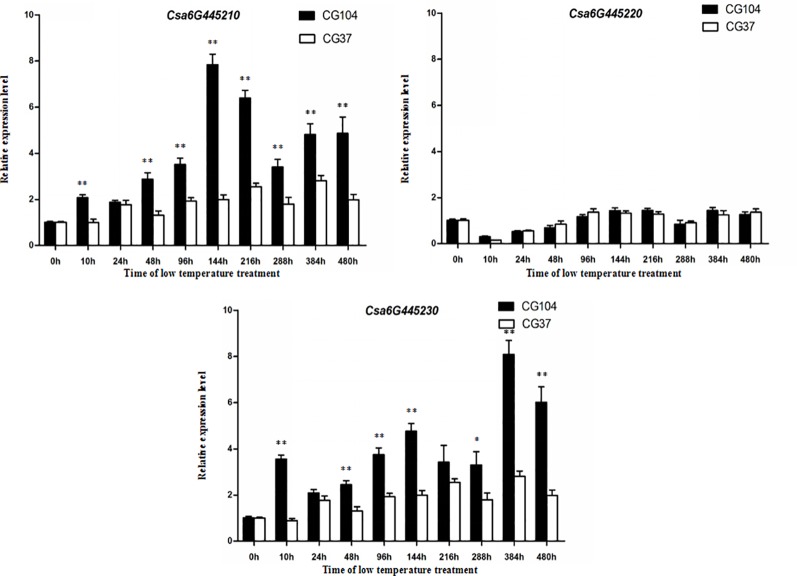
Figure 5.
Expression analysis of three candidate genes. The fold-change indicates the relative amount of gene transcripts at different time-points compared to 0 h. The asterisks indicate that there were significant differences in transcript level between “CG104” and “CG37” (“*,” 0.01 < P < 0.05; “**,” 0.001 < P < 0.01; “***,”0 < P < 0.001).

