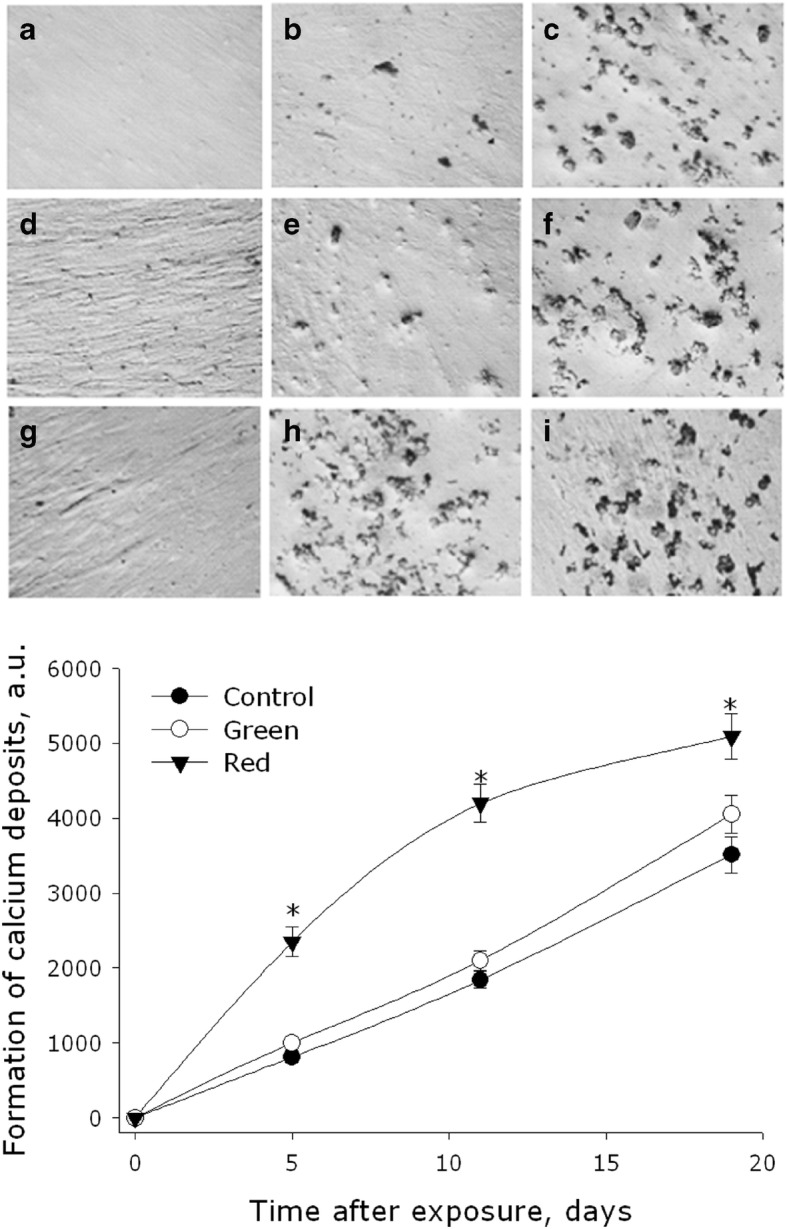
Fig. 5.

Effect of electromagnetic waves, with maxima in the green or red regions of the spectrum, on the formation rate of crystalline calcium phosphate in MMSC culture. Representative micrographs are presented. Micrographs show colored crystalline calcium phosphate in intact cells (a–c) and cells exposed to green (d–f) and red (j–i) light. The cells were cultured for 5 (a, d, f), 11 (b, e, h), and 19 (c, f, i) days. The graph shows the numerical values characterizing the calcification of cells. Data are represented as the means ± SEM of three independent experiments. The asterisks mark the values that significantly differ from the control at p < 0.05 (Student’s unpaired t test)
