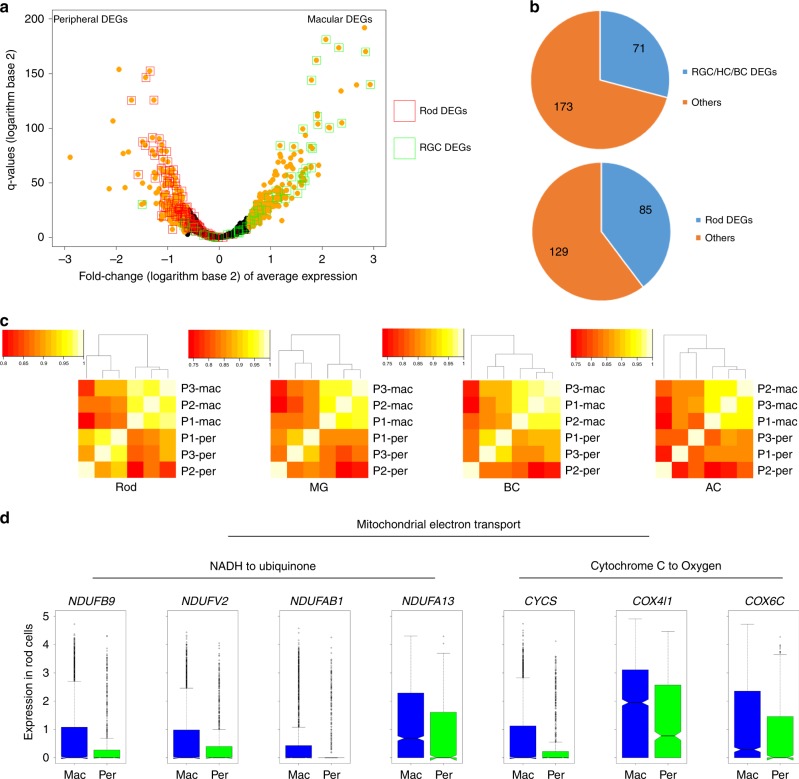
Fig. 3.
Transcriptome difference revealed between macular and peripheral region. a Differentially expressed genes between the overall macular and peripheral cells. All genes detected in more than 20% of macular or peripheral cells were plotted. Macular/Peripheral DEGs by overall comparison were labeled orange. Rod DEGs and RGC DEGs were labeled as red and green boxes, respectively. b The proportion of cell-type DEGs in the overall macular-peripheral DEGs showing cell population affection on DEG detection. c Heatmap demonstrating the correlation of averaged gene expression of four major cell types (rod, MG, BC, AC) in six samples. d Demonstration of mitochondrial-electron transport-related genes showing differential expression in rod cells in the macular and peripheral region. In the box plots, bounds of the box spans from 25 to 75% percentile, center line represents median, and whiskers visualize 1.5 times inter-quartile range less than quartile 1 or 1.5 times inter-quartile range more than quartile 3 of all the data points.

