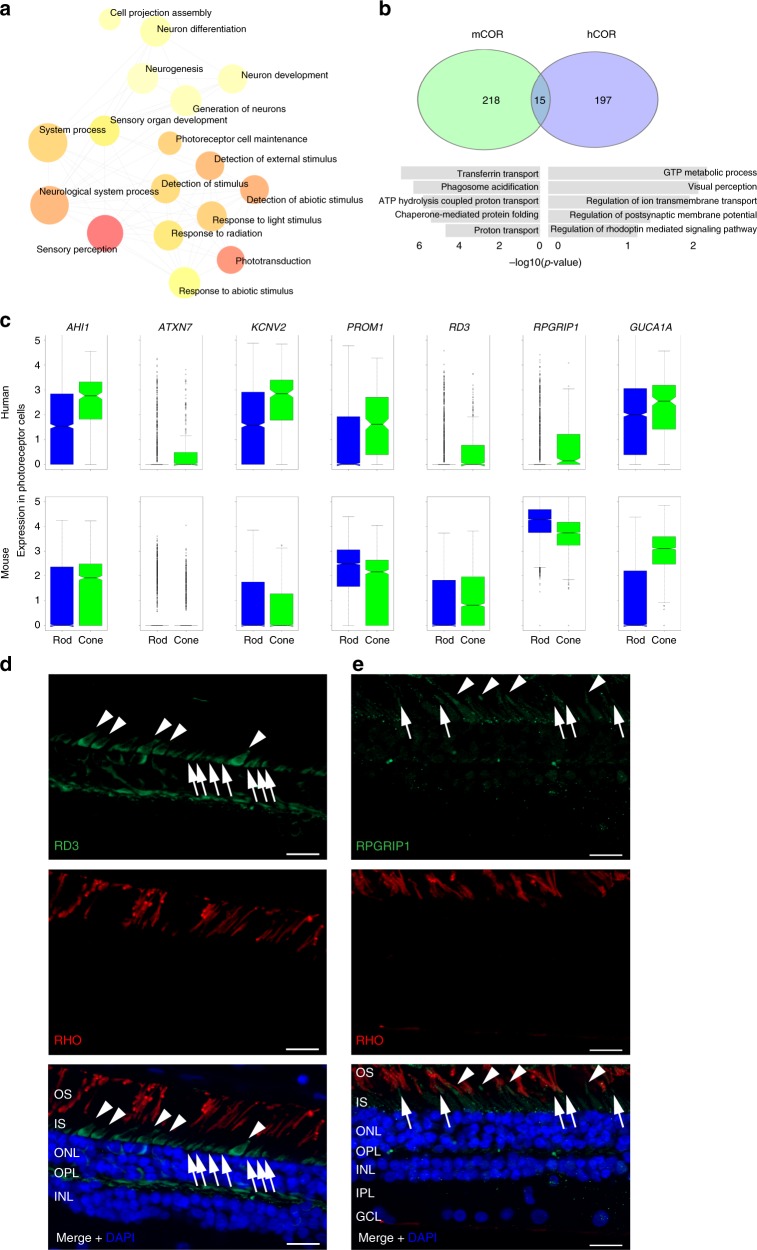
Fig. 4.
Differentially expressed genes are revealed in rod and cone photoreceptors. a Gene ontology networks demonstrate the biological process GO terms enrichment by photoreceptor cell DEGs. All photoreceptor cell DEGs (177 genes) were used as input for the online software NetworkAnalyst76 and only the terms with FDR adjusted p-value less than 0.05 were visualized. Terms were colored according to the p-value from low (red) to high (yellow). b Overlap of the hCOR (human cone-over-rod) and mCOR (mouse cone-over-rod) gene list and biological process GO term enriched in non-overlapping part. c Demonstration of the expression of CRD/LCA genes in the non-overlapping part of hCOR (AHI1, ATXN7, KCNV2, PROM1, RD3, RPGRIP1) and mCOR (GUCA1A). In the box plots, bounds of the box spans from 25 to 75% percentile, center line represents median, and whiskers visualize 1.5 times inter-quartile range less than quartile 1 or 1.5 times inter-quartile range more than quartile 3 of all the data points. d Immunofluorescent staining for RD3 and RHO on human retina cryosections. White triangles and arrows highlight the fluorescent signal of the cones and rods, respectively, in the top and bottom panel. Retinal cell layers are labeled in the bottom panel (OS outer segment, IS inner segment, ONL outer nuclear layer, OPL outer plexiform layer, INL inner nuclear layer, IPL inner plexiform layer, GCL ganglion cell layer). Scale bar is 20μm. e Immunofluorescent staining for RPGRIP1 and RHO on human retina cryosections. White triangles and arrows highlight the fluorescent signal of the cones and rods, respectively, in the top and bottom panel. Retinal cell layers are labeled in the bottom panel. Scale bar is 20μm.

