Fig. 5.
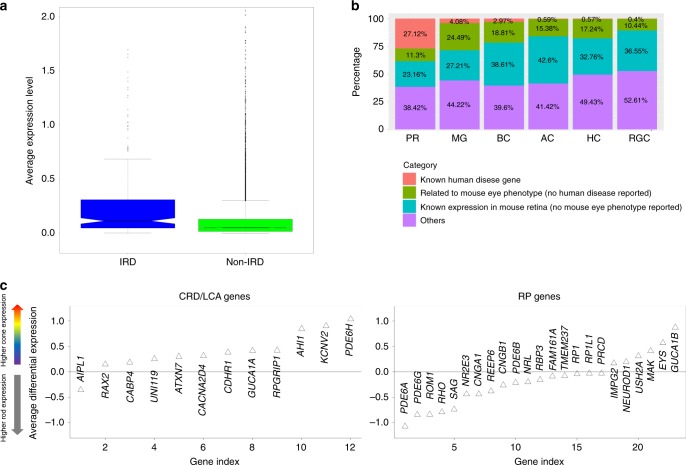
Photoreceptor DEGs enrich human IRDs. a IRD genes generally show higher expression level than the rest of genes in the human retina. Expression values for each gene were normalized by cell total reads, multiplied by 10,000 and then log-transformed (natural logarithm), before averaging. In the box plots, bounds of the box spans from 25 to 75% percentile, center line represents median, and whiskers visualize 1.5 times inter-quartile range less than quartile 1 or 1.5 times inter-quartile range more than quartile 3 of all the data points. b Distribution of human retinal disease genes, mouse eye phenotype genes (but no human disease discovered), mouse retinal expressing genes (but no eye phenotype found) in DEGs of all cell types. c RP genes and CRD genes show different expression trend in rod and cone photoreceptors. The y-axis is representing the differential expression of each gene in cone cells compared with rod cells (cone expression level minus rod expression level). Expression values for each gene were normalized by cell total reads, multiplied by 10,000 and then log-transformed (natural logarithm), before averaging within cell types (rod, cone).

