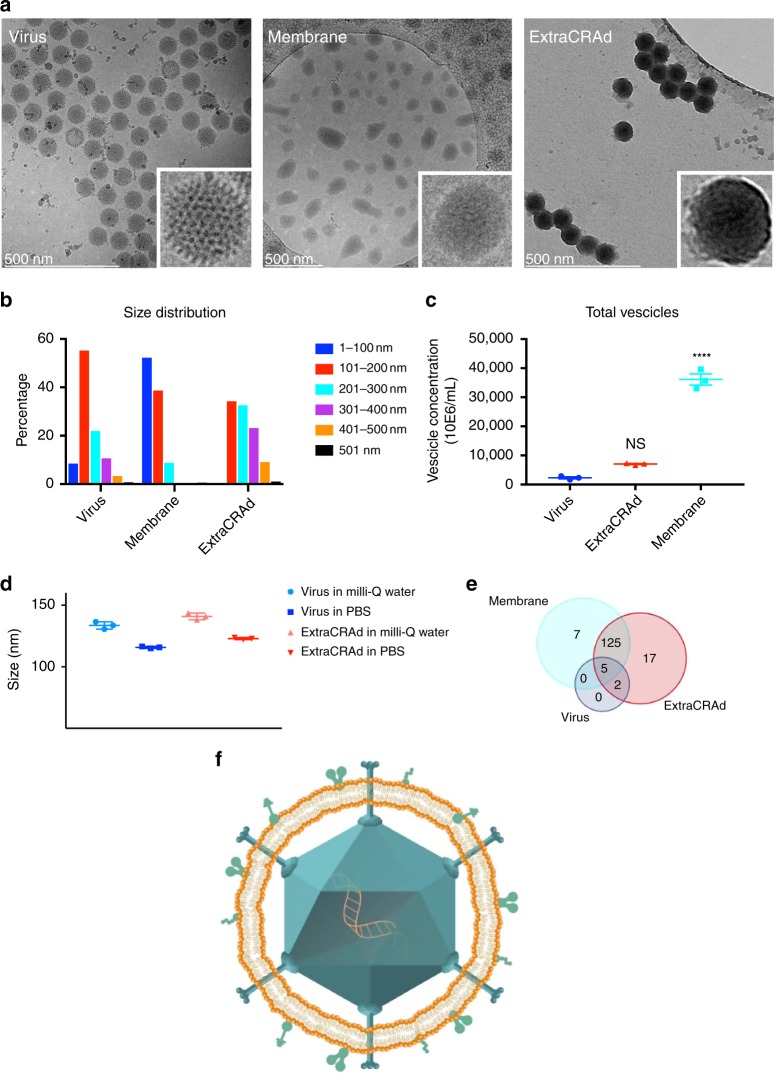
Fig. 2. Physical characterization of ExtraCRAd.
A Cryo-transmission electron microscopy (TEM) images of a virus, b lipid cancer membrane vesicles, and c ExtraCRAd. B16.OVA cell line was employed as source for the membrane. Scale bar: 500 nm. The insets on the right were magnified ten times compared to the original image. b Nano-tracking analysis (NTA) showing the size distribution of the samples. The size distribution is expressed as percentage of the total population. The size intervals are presented on the right. c NTA quantification of the concentration of viral particles or nanosized vesicles in the samples. The results are presented as number × 106 vesicles per ml. The data were analyzed by two-way ANOVA followed by Tukey’s post-test. The level of statistical significance was set at probability level ****p < 0.0001. d Dynamic light scattering (DLS) size analysis of the system in different extrusion buffers. The results are presented as mean ± s.d. (n = 3). e Venn-diagram representing the results retrieved from the mass spectrometry analysis of the samples (virus, ExtraCRAd produced with membranes derived from human lung cancer A549 cells and extruded membrane vesicles from A549 cells). The Venn size reflects the total number of unique proteoforms for each sample, with the shared proteins presented in the intersection of the diagrams. f Graphic illustration of an ExtraCRAd: adenovirus 5-D24-CpG (light blue), lipid membrane (orange), and proteins (light green). The error bars indicate s.d.

