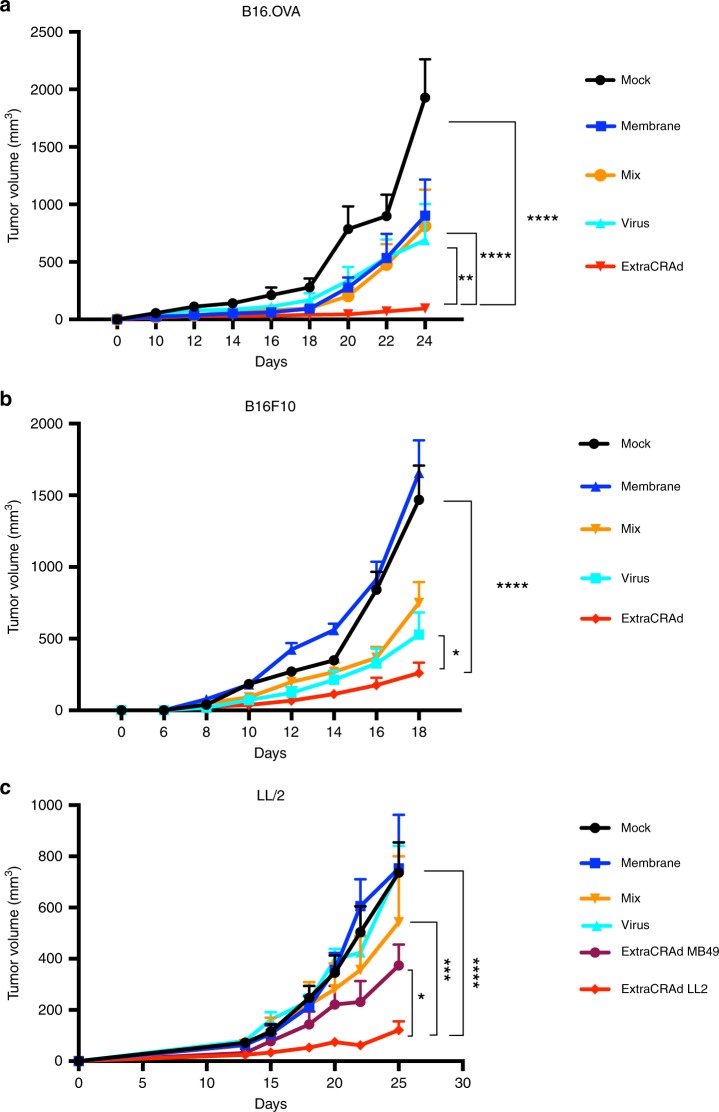
Fig. 4. Efficacy of the treatment with ExtraCRAd in three mouse tumor models.
Median tumor growth curves for a B16.OVA, b B16.F10, and c LL/2. In the median curves the data are presented as mean ± s.d (n ≥ 7). Error bars represent s.d. The results were analyzed with a two-way ANOVA, followed by Tukey’s (a, b) and Dunnet’s (c) post-test comparison, and the levels of significance were set at the probabilities of *p < 0.05, **p < 0.01, ***p < 0.001, ****p < 0.0001. Mice were injected every second day four times starting at day 8 post-injection for B16.OVA and LL/2 and at day 6 post-injection for B16.F10.

