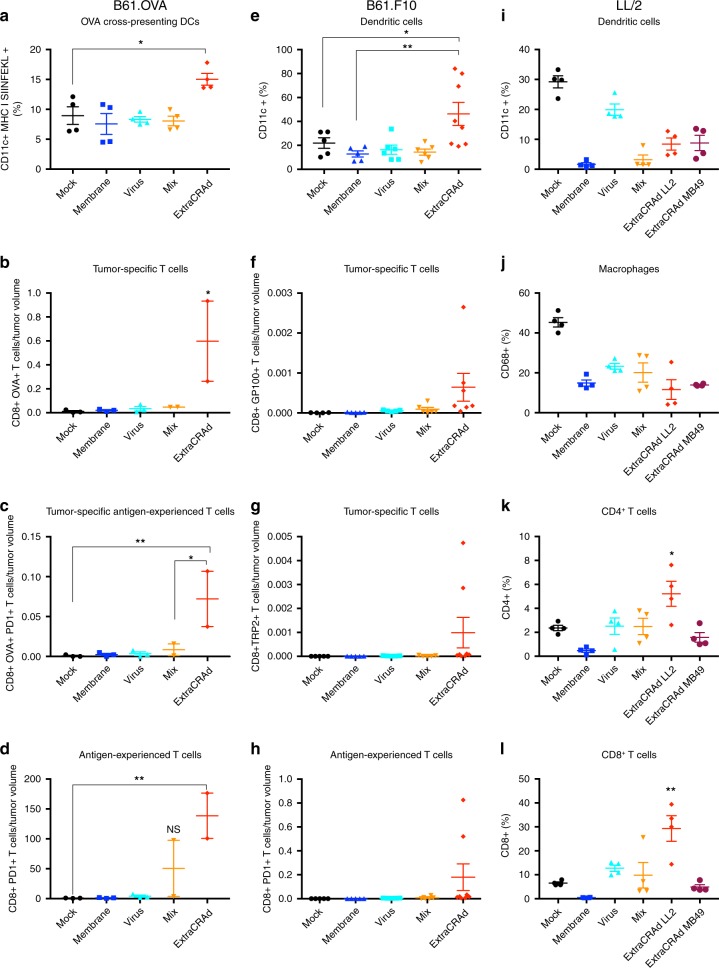
Fig. 5. Immunological analyses of the tumor microenvironment.
B16.OVA a Percentage of dendritic cells cross-presenting OVA (SIINFEKL) in the context of MHC class I in the tumor microenvironment, b OVA-specific, c OVA-specific antigen-experienced, and d antigen-experienced T cells in the tumor microenvironment. The number of T cells was normalized by the tumor volume. Mix identifies a treatment composed of cell membrane vesicles just mixed with adenovirus without extrusion. The results are presented as mean ± s.d (n ≥ 3) and the dot plot of the single replicates. The data were analyzed with a two-way ANOVA, followed by Dunnet (a–c) or Tukey (d) post-test comparison. The levels of significance were set at the probabilities of *p < 0.05, **p < 0.01, ***p < 0.001, ****p < 0.0001. B16F10 e CD11c+ dendritic cells percentage in the tumor microenvironment and f gp100 and g TRP2 pentamer-specific T-cells, identifying the CD8+ tumor-specific T-cells in the tumor microenvironment. h Antigen-experienced T-cells measured by the expression of PD-1 on T-cells. Mix identifies a treatment composed of cell membrane vesicles just mixed with adenovirus without extrusion. The data are presented as mean ± s.d (n ≥ 7), together with the dot plot of the single value. The data were analyzed with two-way ANOVA, followed by Fisher LSD post-test. The levels of significance were set at the probabilities of *p < 0.05, **p < 0.01. LL/2 i Percentage of CD11c+ dendritic cells in the tumor microenvironment in the LL/2 model. j Percentage of CD68+ macrophages. k Percentage of CD4+ and l CD8+ T-cells in the tumor microenvironment. Mix identifies a treatment composed of cell membrane vesicles just mixed with adenovirus without extrusion. The data are presented as mean ± s.d. (n = 4) and were analyzed by two-way ANOVA, followed by Dunnet’s post-test. The levels of significance were set at the probabilities of *p < 0.05 and **p < 0.01. The error bars represent s.d.

