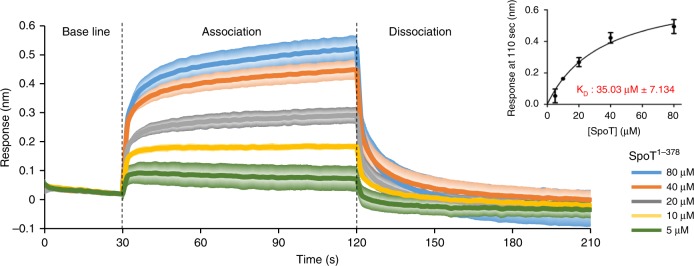
Fig. 7. YtfK can interact with the catalytic domain of SpoT in vitro.
BioLayer interferometry assay. The graph shows the subtracted reference binding responses during the association and dissociation of SpoT on YtfK. For kinetic titration analysis: increasing concentrations of recombinant SpoT1–378 (5–80 μM) were bounded to biotinylated YtfK (2.5 µM). Error bars (presented in degraded colors) indicate the standard deviations of averages of three experiments. The inset graph shows the specific BlI response (nm) 10 s before the end of association as a function of SpoT1–378 concentration (5–80 µM). Each data point (mean +/− SD) is the result from triplicates studies used to determine dissociation constant KD. Source data are provided as a Source Data file.

