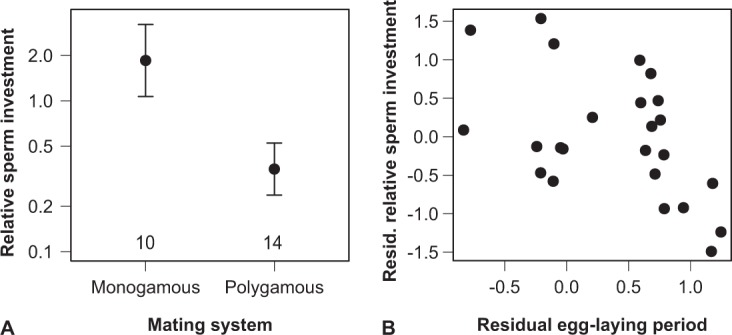
Figure 2.

Graphical representation of the response of the relative sperm investment, ln(sperm length/sperm number), to (A) the social mating system as a proxy of sperm competition and (B) the female egg-laying period. (A) depicts the least-squares means with 95% confidence intervals and sample sizes, after controlling for the female egg-laying period and body mass. (B) shows the partial regression derived from the same model, controlling for body mass and the social mating system on both axes.
