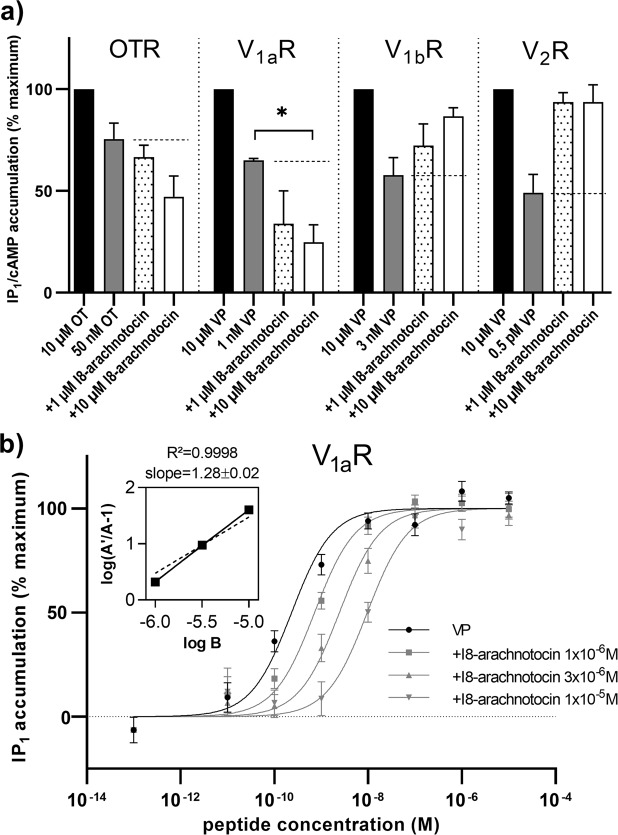
Figure 4.
I8-arachnotocin is a competitive antagonist at V1aR. (a) Accumulation of second messengers (IP1 and cAMP) with partial activating concentrations of endogenous ligands (50 nM OT at OTR; 1 nM VP at V1aR; 3 nM VP at V1bR; 0.5 pM at V2R) in the absence and presence of 1 or 10 µM I8-arachnotocin in comparison to a saturating concentration of endogenous ligand (10 µM). All data were normalized to second messenger accumulation above baseline (0%) and maximum (100%) activity of the endogenous ligand. The dashed line depicts IP1/cAMP accumulation in the absence of I8-arachnotocin. Error bars depict SEM. n = 3, except n = 2 for V1aR (error bars depict SD). The asterisk (*) indicates significance in Student’s t-test (p = 0.0226). (b) Accumulation of IP1 by stimulation of human V1aR with VP (10 pM – 10 µM) alone or in the presence of 1, 3 or 10 µM I8-arachnotocin. Receptor activation was normalized to the accumulation of IP1 above baseline. Data points were normalized to the maximum (100%) and minimum (0%) response generated by VP. Error bars depict SEM; n = 3. Insert: Schild regression analysis: A = EC50 of VP in presence of I8-arachnotocin; A′ = EC50 of VP; B = logarithm of I8-arachnotocin concentration; Schild slope 1.28 ± 0.02 (SEM), R2 = 0.9998. The dotted line represents a reference line with a slope of 1; n = 3.

