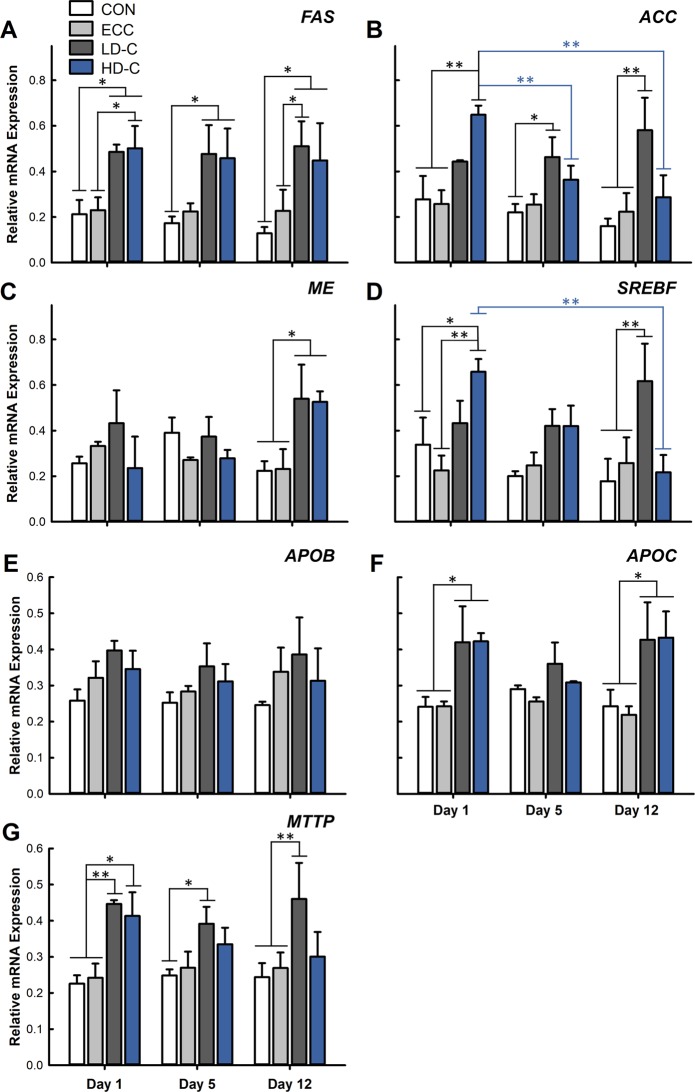
Figure 3.
Corticosterone treatment modulates mRNA gene expression of lipid metabolism genes within the liver. Birds were administered standard drinking water (CON treatment), 0.2% ethanol drinking water (ECC treatment), 10 mg/L CORT (LD-C treatment), or 30 mg/L CORT (HD-C treatment); birds were euthanized and sampled at 1, 5, or 12 days post-CORT administration. (A–G) Relative expression of mRNA transcripts. (A) FAS. (B) ACC. (C) ME. (D) SREBF1. (E) APOB. (F) APOC3. (G) MTTP. Vertical lines associated with histogram bars represent standard error of the means (n = 3). *p < 0.05, **p < 0.01, ***p < 0.001, and ****p < 0.0001.

