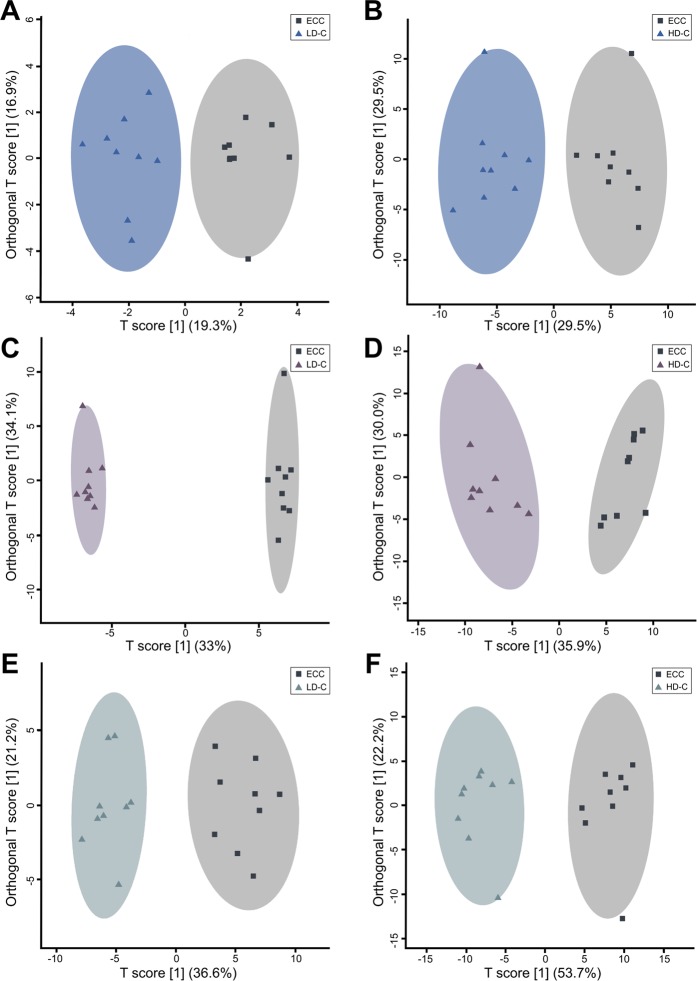
Figure 4.
Metabolite profiles of kidney, liver, and breast muscle. OPLS-DA plots showing supervised separation for (A,B) kidney tissue, (C,D) liver tissue, and (E,F) breast muscle tissue, where (A,C,E) shows separation between birds administered 0.2% ethanol in drinking water (ECC treatment) or 10 mg/L CORT drinking water (LD-C treatment), and (B,D,F) shows separation between ECC treatment birds or 30 mg/L CORT of drinking water (HD-C treatment). Each square or triangle represents one bird; data was plotted using metabolites identified to be significant by MW and/or VIAVC. n = 9 birds per treatment.

