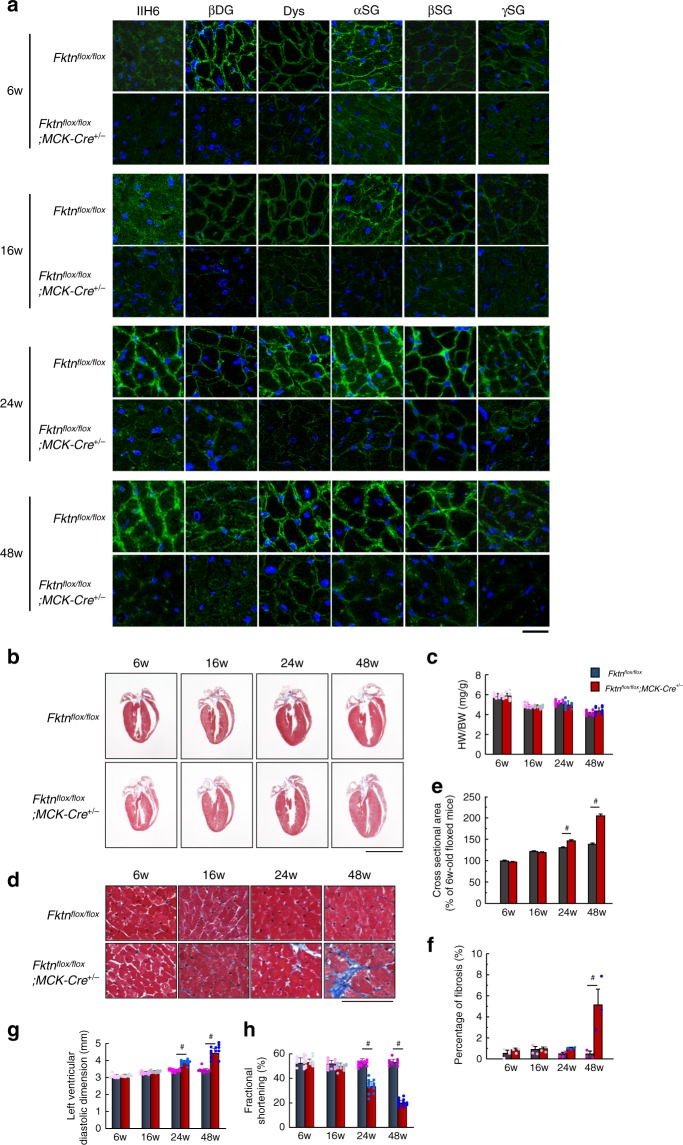
Fig. 1. Cardiac change in MCK-Fktn-cKO (Fktnflox/flox; MCK-Cre+/−) mice.
a Representative immunofluorescent images of DGC complex and glycosylation form of α-DG in control (floxed) and MCK-Fktn-cKO hearts. Anti-IIH6 (glycosylated form of αDG), βDG, dystrophin (Dys), αSG, βSG, and γSG antibodies (green) and DAPI (blue). Scale bar, 10 μm. b Cardiac morphology in floxed and MCK-Fktn-cKO mice. Scale bar, 5 mm. c Heart weight-to-body weight ratios (HW/BW) (n = 9 mice per group). d Masson’s trichrome staining of the left ventricle. Scale bar, 50 μm. Cross-sectional areas (6w, n = 259 and 268 cells; 16w, n = 303 and 311 cells; 24w, n = 266 and 287 cells; 48w, n = 283 and 256 cells measured from 3 hearts per group.) (e) and fibrosis percentages (n = 3 mice per group) (f) from paraffin sections of left ventricles. Echocardiographic parameters of left ventricle diastolic dimension (g) and fractional shortening (h) in floxed and MCK-Fktn-cKO mice (n = 12 mice per group). Data are means ± s.e.m; #P < 0.05 between indicated groups based on Student’s t-tests.

