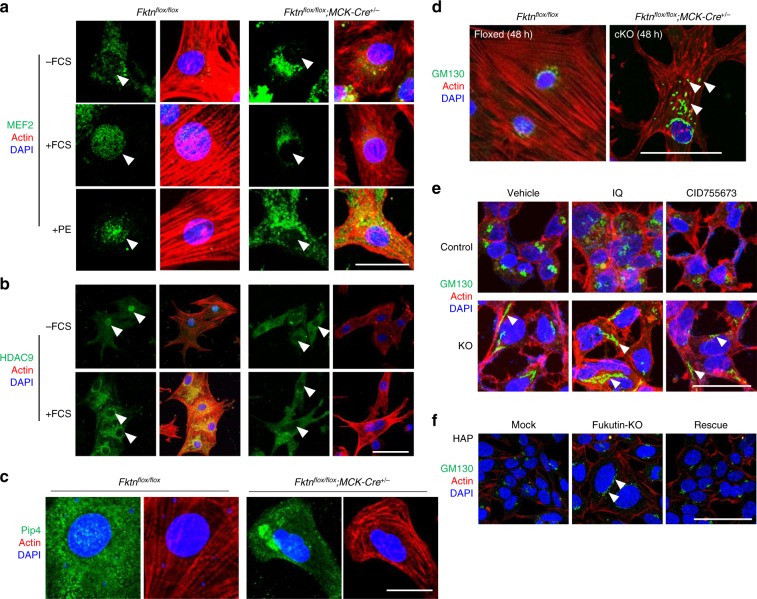
Fig. 5. Impaired MEF2-HDAC axis of MCK-Fktn-cKO (Fktnflox/flox; MCK-Cre+/−) cardiomyocytes.
a Representative images of MEF2 localization in cardiomyocytes treated with FCS or PE for 48 h. Scale bar, 20 μm. b Representative images of HDAC9 localization in cardiomyocytes cultured with or without FCS. Scale bar, 100 μm. c Representative images of PI4P accumulation in cardiomyocytes. Scale bar, 20 μm. d Representative images of GM130 distribution in cardiomyocytes. Scale bar, 50 μm. e Effects of a PKD activator (ilimaquinone (IQ)) and a PKD inhibitor (CID755673) on GM130 distribution in control and FKTN-deficient (KO) HEK cells. Arrowheads show abnormally distributed GM130 signals. Scale bar, 100 μm. f Representative images of GM130 distribution in control (mock), FKTN-deficient (fukutin-KO), and rescued (fukutin-KO transfected with pcDNA-FKTN-FLAG) HAP cells. Arrowheads show abnormally distributed GM130 signals. Scale bar, 100 μm.

