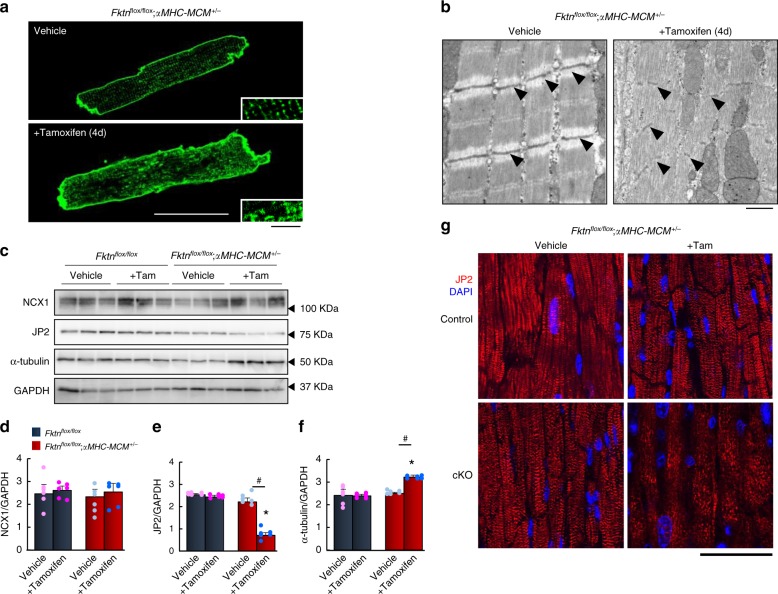
Fig. 7. Subcellular change in αMHC-MCM-Fktn-cKO (Fktnflox/flox; αMHC-MCM+/−) myocytes.
a Representative membrane staining by di-8-ANEPPS. Scale bar, 50 μm (inset, 10 μm). b Representative electron micrographs of myofilaments in vehicle- and tamoxifen-treated αMHC-MCM-Fktn-cKO mice. Arrowheads show Z-lines. Scale bar, 1 μm. Representative immunoblots (c) and expression levels (d–f) for NCX1, JP2, and α-tubulin in floxed (control) and αMHC-MCM-Fktn-cKO mice with or without tamoxifen. GAPDH was used as a loading control (n = 6 mice per group). *P < 0.05 vs. vehicle-treated floxed mice; #P < 0.05 between indicated groups based on Tukey–Kramer tests. g Representative immunostaining for JP2 (red) and DAPI (blue). Scale bar, 50 μm.

