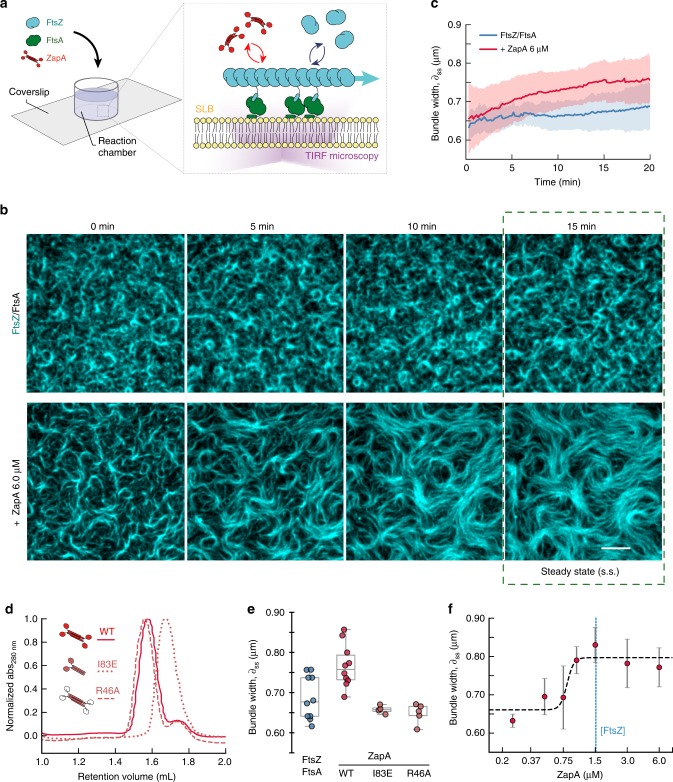
Fig. 1. ZapA increases the width of membrane-bound FtsZ filament bundles.
a Illustration of the experimental assay based on a supported lipid bilayer, purified proteins and TIRF microscopy. b Snapshots of FtsZ pattern emerging from its interaction with FtsA alone (top row) and in the presence of 6 μM ZapA (lower row). Concentrations of FtsZ (30% Cy5-labelled) and FtsA were kept constant for all experiments (1.5 μM and 0.5 μM, respectively). Scale bars, 5 μm. c Estimated mean bundle width, δ, over time for FtsZ/FtsA filament pattern (blue) and with 6 μM ZapA (red). Curves depict the mean and the standard deviation (std) as shaded error bands of independent experiments (FtsZ, n = 10, ZapA, n = 10). d Size-exclusion chromatography results for ZapA wild type (WT) and mutants (ZapA I83E, ZapA R46A). e Mean bundle width, δss, of membrane-bound FtsZ filaments is increased in the presence of 6 μM ZapA (red) (two-tailed t test with p = 0.004) while it was unchanged in the presence of ZapA I83E and ZapA R46A (light red) (p > 0.05). f Change in δss with varying concentrations of ZapA. Data shown (steady state) corresponds to the average bundle width measured between t = 15 min and t = 20 min (mean ± std). Black line corresponds to Hill equation fit with nH = 13.86 and EC50 = 0.81 μM with 90% confidence intervals of [13.86–94.68] and [0.71, 0.98], respectively, obtained from bootstrapping distributions. Source data available at Figshare [10.6084/m9.figshare.10347062.v1].

