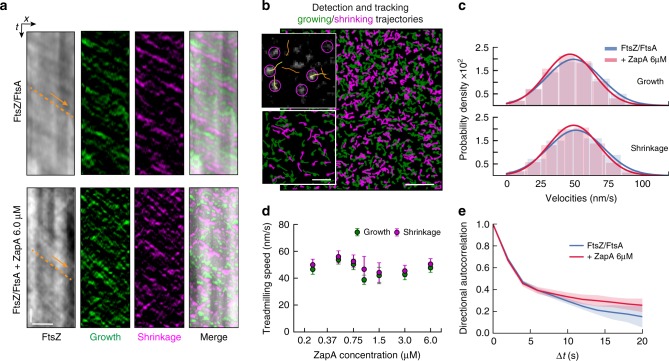
Fig. 5. ZapA does not change treadmilling speed of FtsZ filaments.
a Kymographs obtained along the orange line in Fig. 4b. Images represent the channel with the raw data, the two differential channels (growth and shrinkage trajectories) and the merged image. Arrows indicate treadmilling direction. Scale bars, t = 20 s, x = 3 μm. b Snapshot showing an example of detection (purple circles) and tracking (yellow/orange lines) of fluorescent spots and the respective generated growing and shrinking trajectories, respectively. First position of each trajectory is indicated with circles. Scale bars: large image, 5 μm; small image, 2 μm. c Velocity distribution of filament growth (upper panel, FtsZ/FtsA, ν+ = 50.5 ± 20.1 nm/s, FtsZ/FtsA + ZapA, ν+ = 47.8 ± 18.2 nm/s, n = 10) and shrinkage (lower panel, FtsZ/FtsA, ν− = 53.0 ± 20.7 nm/s, FtsZ/FtsA + ZapA, ν− = 50.4 ± 18.6 nm/s, n = 10). Both show a normal distribution without any significant difference in the mean. d Increasing concentrations of ZapA had no effect on the mean velocity of FtsZ filaments at either end (p > 0.05; Supplementary Table 1). e Directional autocorrelation revealed that directionality was increased in the presence of 6 μM ZapA (red) when compared to FtsZ/FtsA (blue). Data shows the average autocorrelation curve from individual experiments (shaded bars = std, n = 10). Source data available at Figshare [10.6084/m9.figshare.10347062.v1].

