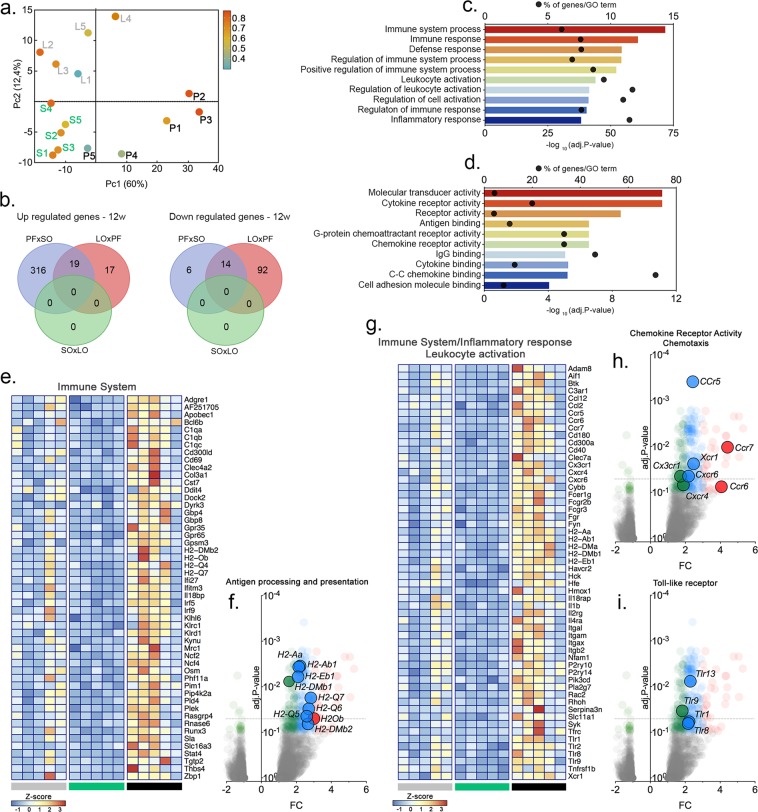
Figure 5.
Dietary fatty acids in normolipidic diets modulate the immune system and inflammation in the mouse VP. C57/BL6 mice were fed the specified diets for 32 weeks and the VP transcriptome was examined by RNAseq. Principal component analysis (PCA) segregated the PF results from the other two groups, which were segregated by the second component. (a) The number of genes differentially expressed in the different groups are presented as Venn diagrams. (b) Biological processes and molecular functions affected by the different diets are shown in (c,d) according to their significance; bars represent the p-values and dots represent the ratios between the number of genes differentially expressed and the total number of annotated genes (enrichment) within each ontology. Genes differentially expressed were represented in Volcano plots in a pair-wise format; the graphs show each gene’s expression (Log2 fold change) and the corresponding p-value for each pair-wise comparison. Genes related to protein localization/targeting to the EA, ER stress and fatty acid biosynthesis were also represented in a heatmap (e–i), using normalized expression values (Z-Score) for each gene (n = 5).

