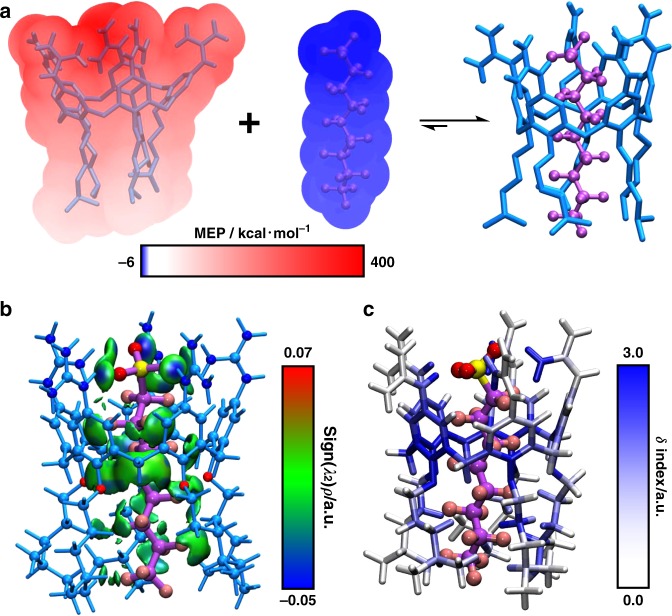
Fig. 2. Binding geometry of GC5A-6C and PFOS.
a The optimized binding geometry of the GC5A-6C•PFOS complex (right) at the B3LYP-D3/6–31G(d)/SMD(water) level of theory and the MEP-mapped molecular van der Waals surfaces of GC5A-6C (left) and PFOS (middle). b δginter = 0.01 a.u. isosurfaces colored by the sign of (λ2)ρ for the GC5A-6C•PFOS complex (the meaning of δginter and sign(λ2)ρ were in ref. 58). Blue indicates strong attraction, while red indicates strong repulsion. c The atoms of GC5A-6C colored according to their contributions to the binding with PFOS. White indicates no contribution to the complexation, and blue indicates the largest relative contribution.

