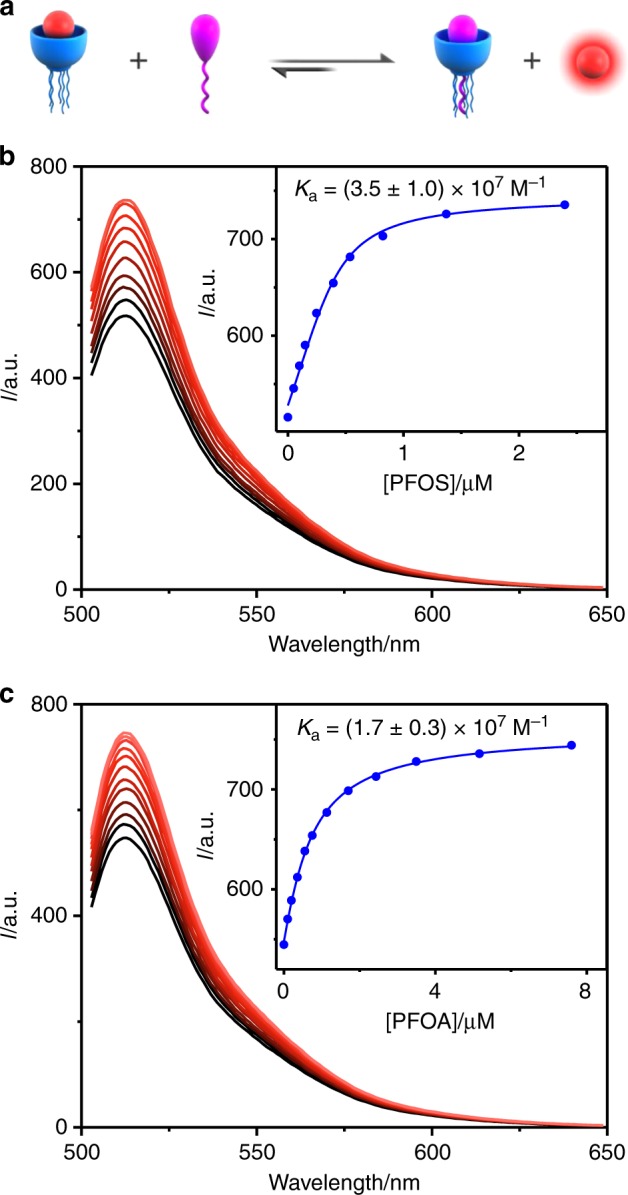
Fig. 3. Illustration of the IDA principle and fluorescence titrations.

a Illustration of the IDA principle. Competitive titrations of GC5A-6C•Fl (0.4/0.5 μM) with b PFOS (up to 2.4 μM) and c PFOA (up to 7.6 μM). (Inset) The associated titration curves of b PFOS and c PFOA fit according to a 1:1 competitive binding model. All experiments were performed in HEPES buffer at 25 °C, λex = 500 nm, and λem = 513 nm. Data represent mean ± s.d. (n = 3 independent experiments).
