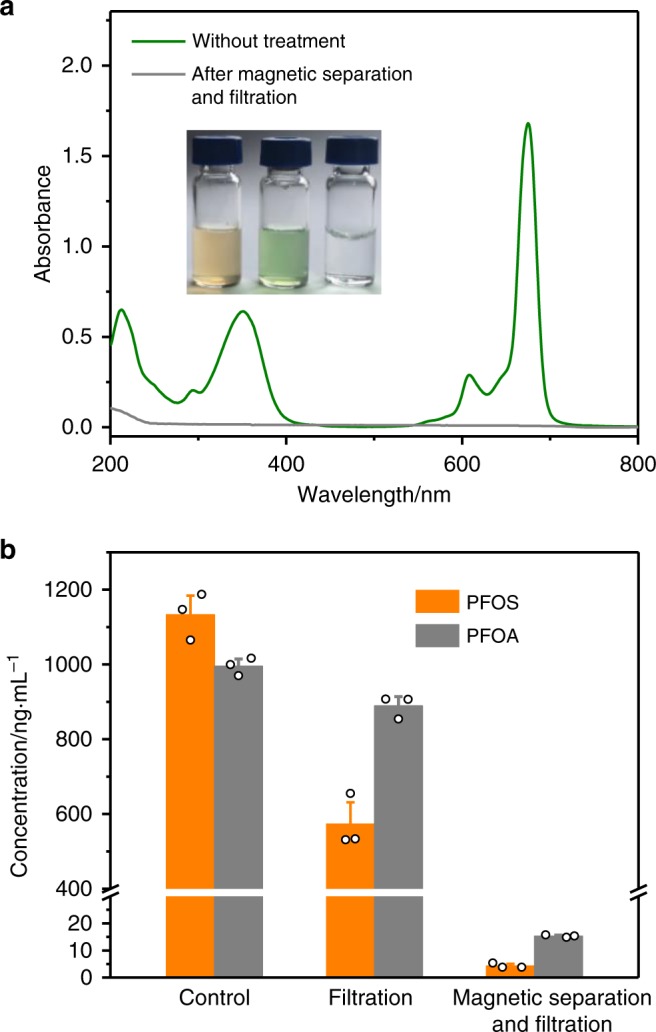
Fig. 8. Absorption of AlPcS4, PFOS, and PFOA in water samples.

a Absorption spectra of AlPcS4 (10 μM) without any treatment and after magnetic separation by MNP@GC5A-12C and filtration. (Inset) Photographs of MNP@GC5A-12C ([GC5A-12C] = 100 μM) (left), MNP@GC5A-12C ([GC5A-12C] = 100 μM) with AlPcS4 (10 μM) (middle), and the filtrate after magnetic separation and filtration (right). b Concentrations of PFOS and PFOA with only filtration, and with both magnetic separation and filtration are quantified by the UPLC–ESI-MS/MS system. Concentrations of PFOS and PFOA without magnetic separation are shown as a control. Error bars in (b) represent mean ± s.d. (n = 3 independent experiments).
