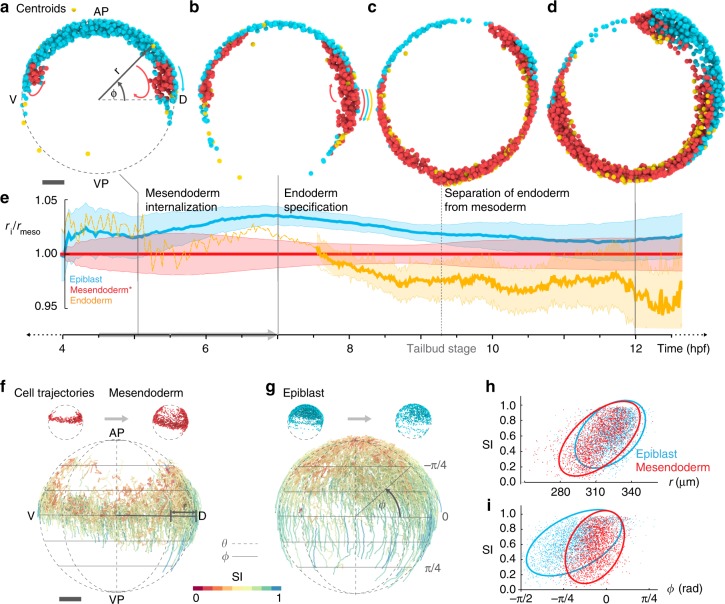
Fig. 2. Position dependent organization of cell movement during early gastrulation.
a–d Lateral views of the embryo at 4, 6.5, 9, and 11.5 hpf showing rendered object centroids located within a plane through the body axis (± 78 μm). Colors indicate the corresponding germlayer: epiblast (blue) mesendoderm (red) and endoderm (yellow). Colored arrows in (a) indicate epiboly of epiblast (blue) and internalization of mesendoderm (red), in b indicate epiboly movement of all three germlayers. AP: animal pole, VP: vegetal pole, D: dorsal, V: ventral. e Line plot showing mean radial position of all germlayers (normalized with respect to average radius of the mesendoderm) for a single embryo. Bands indicate mean + /− 0.3 standard deviation, the scaling was introduced to reduce overlap between germlayers and to visually highlight the thinning of layers. Dashed yellow line indicates the period before endoderm specification. f Cell trajectories for mesendodermal cells during early gastrulation (4.5–7 hpf; indicated by gray arrow in e) shown in lateral view. Color code indicates the straightness indices (SI) of trajectories. g Cell trajectories for epiblast cells, same views and color code as in f. h Scatterplot of SI vs. radial position r (computed at the midpoint) for each trajectory (4.5–7 hpf) of mesendoderm (red), epiblast (blue) and the respective 90% prediction ellipsoids. i Scatterplot of SI vs. position Φ along the longitude (computed at the midpoint) for each trajectory (4.5–7 hpf) of mesendoderm (red), epiblast (blue) and the respective 90% prediction ellipsoids.

