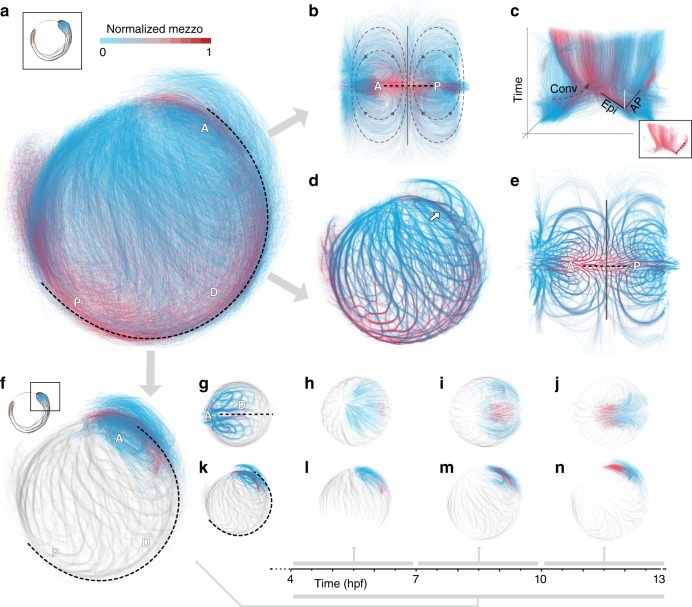
Fig. 5. Exploratory data analysis of long-term pan embryo cell dynamics.
a 3D rendering of long-term cell trajectories (A-anterior, P-posterior, dashed curve-dorsal midline). Color code shows normalized mezzo expression along each track. b 2D Mercator projection of cell tracks (A-anterior, P-posterior, dashed line-dorsal midline), same color code as in a. Principal directions for convergence (dashed-gray) movement and border separating the anterior and posterior flows (solid line along the left-right axis) are shown as overlays. c Space-time plots of long-term tracks over Mercator projection. Z-axis corresponds to time. Gray, dashed arrow illustrates the convergence movement (Conv). Dashed black line highlights movement of mesendodermal cells moving towards animal pole (AP). Solid black line indicates movement of mesendodermal cells undergoing epiboly (Epi). White line shows space-time line of a stationary object for reference. Inset shows subpopulation of cells with high normalized mezzo expression. Same color code as in a. d 3D rendering of bundled, long-term cell trajectories assembled from individual cell tracks (A-anterior, P-posterior, dashed curve-dorsal midline) highlighting structural details of cell migration patterns from 4 to 13 hpf. Color code shows normalized mezzo expression along track. Arrow indicates the internalized stream of mesendodermal cells towards animal pole. e 2D Mercator projection of bundled cell tracks reveals global structure of migration patterns across the developing embryo from 4 to 13 hpf (A-anterior, P-posterior, dashed line–dorsal midline). Border separating the anterior and posterior flows (solid line along the left-right axis) are shown as overlay. f Lateral view of selected anatomical region of interest. Long-term trajectories of cells within ROI are shown for 4–13 hpf time interval. Color code indicates normalized mezzo expression. Cell tracks outside of ROI shown as bundled tracks in gray. g Rotated, dorsal view of selected cell tracks shown in bundled state to highlight structure of cellular flows. h–j Backtracking of cells in ROI in time intervals of 90 min. Same color code as f. Tracks outside of region of interest are shown as gray bundles. k–n Lateral view of selected cell tracks, same visual coding as in g–j.

