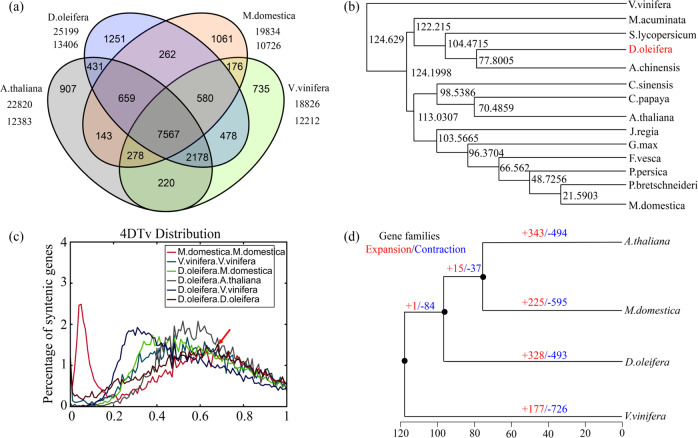
Fig. 2. Comparative genomic analysis of persimmon and other species.
a Venn diagram of shared orthologous gene families in persimmon, Arabidopsis thaliana, Malus domestica and Vitis vinifera. The number of gene families is listed for each component. b Phylogenetic tree constructed from persimmon single-copy gene families with 13 other species, including Vitis vinifera (Vvinifera_145_Genoscope), Actinidia chinensis (v1.0), Musa acuminata, Solanum lycopersicum (SL2.40), Diospyros oleifera, Citrus sinensis, Glycine max (Soybean_Williams82), Carica papaya, Arabidopsis thaliana (TAIR10), Juglans regia, Fragaria vesca, Prunus persica (v2.0), Pyrus bretschneideri, and Malus domestica (v1.0). The numbers indicate the divergence time. c Distribution of 4DTv distance between syntenic orthologous genes. The red arrow indicates the peak value for persimmon. d Gene family expansion and contraction analysis. Gene family expansions and contractions are indicated by numbers in red and blue, respectively. The gray areas represent the conserved gene families.

