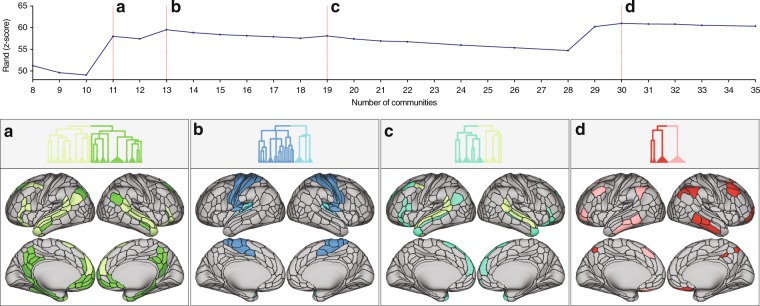
Figure 2.
Top: similarity plot showing the mean similarity between the partitioning in each hierarchical level and the clustering at the subject-level quantified by the z-score of the Rand coefficient. The local maxima in similarity are denoted by the dashed red lines. Bottom: emerging communities at local maxima, (a) The level of 11 communities is characterized by splitting of the default mode community into a mainly midline core community (dark green) and mainly middle temporal lobe community (light green), compared to the preceding level. (b) The level of 13 communities is characterized by the splitting of the auditory community (light blue) from the somatomotor community (dark blue). (c) The level of 19 communities is characterized by the emergence of the language community (turquoise) from lateral default mode (light green). (d) The level of 30 communities is characterized by the hemispheric split of the left and right central executive community (red and pink).

