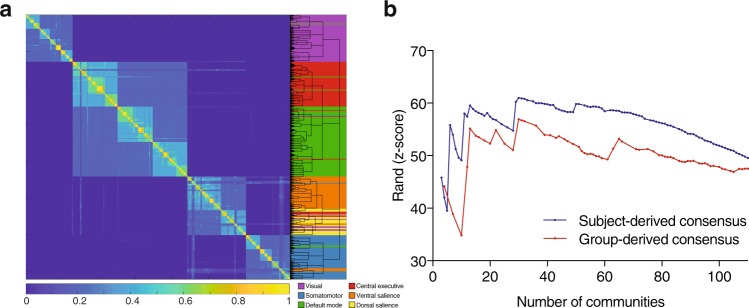
Figure 3.
Group-derived consensus hierarchical partitioning. (a) Co-classification matrix summarizing the results of the group-level clustering, sorted by community affiliation. The dendrogram represents the hierarchical organization of the nested communities. The length of the arms of the dendrogram are proportional to the average value of the local null model. The background colors and key are superimposed from the subject-level consensus clustering that yielded 6 modules in Fig. 1a–c. (b) Similarity plot showing the mean similarity between the clustering at the subject-level, and the partitioning in each hierarchical level (number of communities) in the group-derived consensus partitioning (red) and the subject-derived consensus partitioning (blue); similarity is quantified using the z-score of the Rand coefficient.

