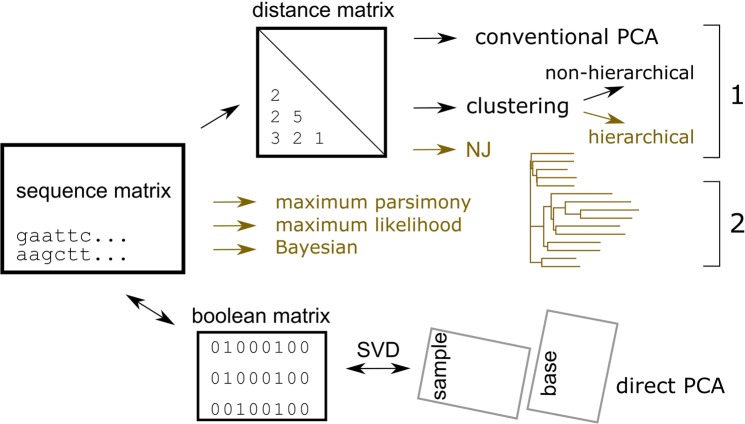
Figure 1.
Schematic diagram of the methods used in the study. Two distinct approaches are used: one estimates the distances among samples, to form a distance matrix using one of various models (Yang, 2006), and then finds the relationships based on the distances. The other finds the relationship directly from the sequence matrix. Only direct PCA shows the relationships of samples and bases coincidently. Methods that estimate a tree-shaped relationship are coloured in oak.

