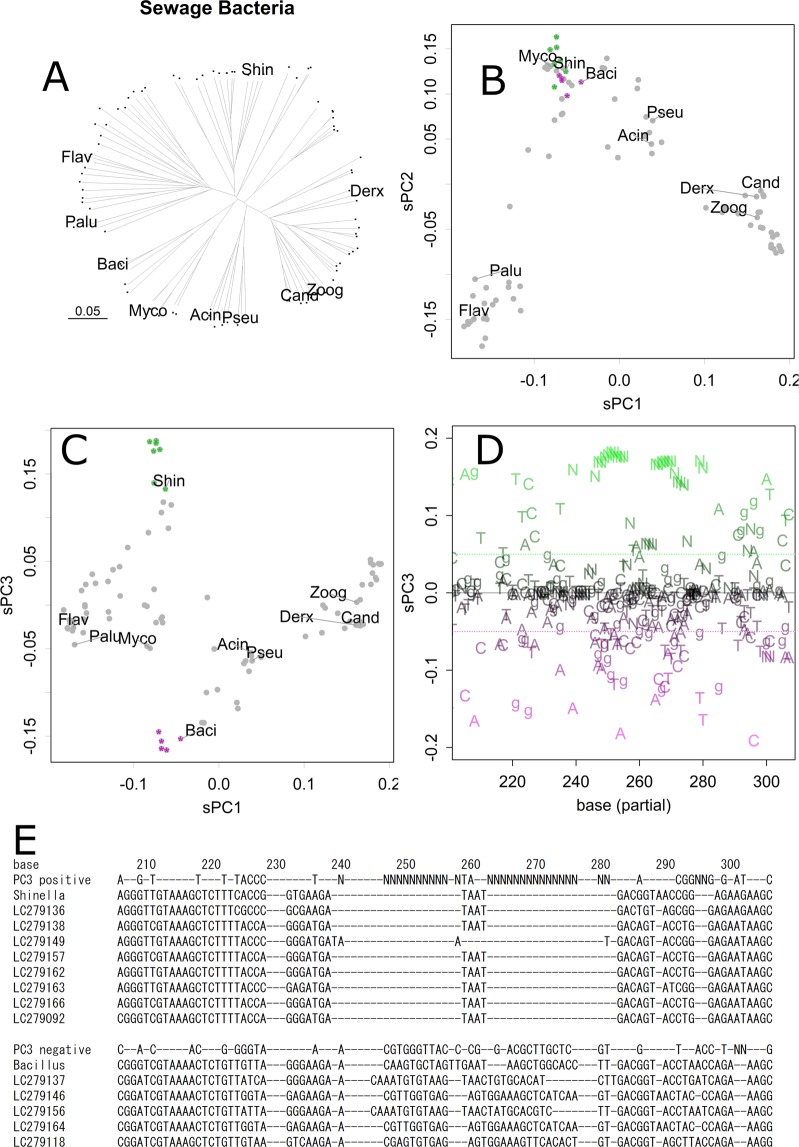
Figure 2.
Analysis of sewage bacteria. Neighbor Joining tree. Each dot presents a sample. All the samples are connected to the tree by a single line. Abbreviations are the first four letters of reference samples for Acinetobacter indicus, Bacillus anthracis, Candidatus Accumulibacter phosphatis, Derxia gummosa, Flavobacterium pectinovorum, Mycobacterium sp. strain FED_F02A, Paludibacter propionicigenes, Pseudomonas punonensis, Shinella kummerowiae, and Zoogloea resiniphila, respectively (A). Scatter plot of scaled PC, sPC1 and sPC2 for samples (B). Scatter plot for sPC1 and sPC3 (C). A 3D version is available in Supplementary information, Fig. 2_BC.html. sPC3 for nucleotides (partial) (D). Positive and negative bases are coloured green and magenta, respectively; those had low contributions are coloured grey, and none contribution are omitted. Shinella, which appeared as a positive in the same sPC3 axis (C), tended to contain bases indicated in green, whereas Bacillus tended to contain bases indicated in magenta. Such tendencies are obvious in a summary of table output of sPCn (E). Bases positive (>0.05) and negative (<−0.05) in sPC3 are shown with sequences of several samples that are indicated in panels B and C by green or magenta asterisks.

