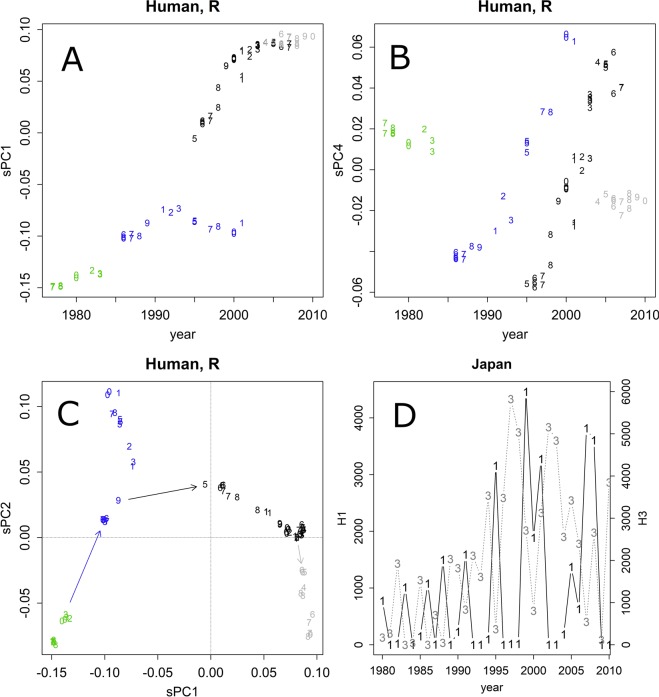
Figure 2.
(A,B) Annual changes of PC1 and PC4, HA of the R group human strains (n = 83). The numbers indicate the last digit of the year. The colours indicate the estimated branches of evolution. Other PC axes are presented in Fig. S4C. (C) Leaps found in the group R strains. In the last branch (grey), the values did not change in PC1, but they reverted in PC2 after 30 years. The numbers indicate the last two digits of the year. (D) Annual changes in H1 (1) and H3 (3) patient counts in Japan.

