Figure 3.
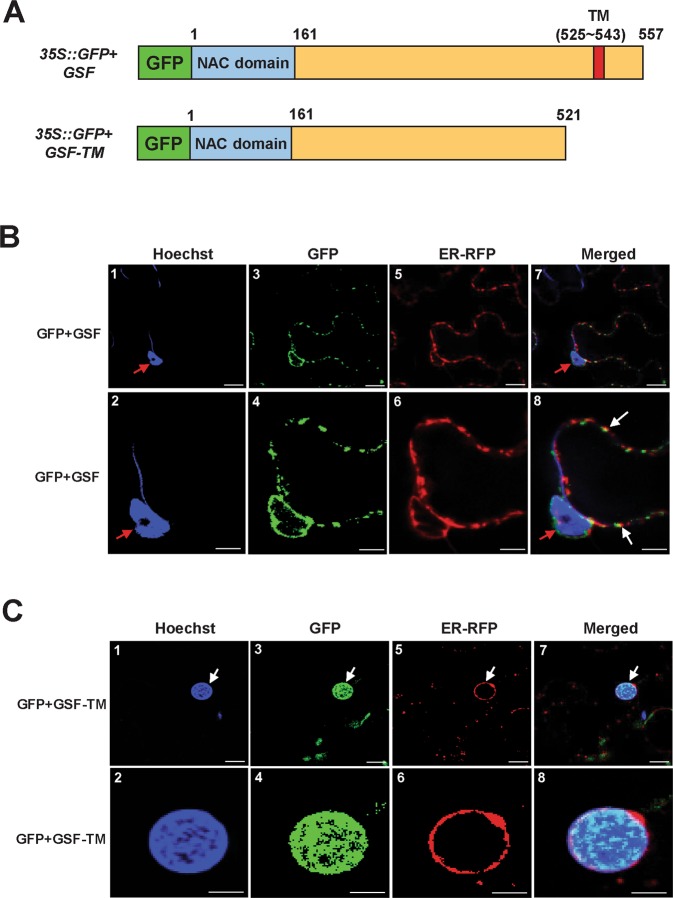
Transient expression of GFP + GSF, GFP + GSF-TM and ER + RFP in tobacco cells. (A) Schematic diagram for the GFP + GSF and GFP + GSF-TM constructs transiently expressed in tobacco leaves. (B) Agrobacterium-mediated transient expression of GFP + GSF and ER + RFP in the epidermal cells of N. benthamiana. The GFP + GSF fusion protein (−3, −4) accumulated in organelle-like structures that were highly similar to the ER where the RFP was localized (−5, −6). Blue DNA-staining (Hoechst) indicated the nuclei (red arrow in −1, −2, −7 and −8). A merged fluorescence image of (−1, −3, −5) in (−7); (−2, −4, −6) in (−8) showing the similar localization of GFP + GSF and ER + RFP (white arrows in −8). (−2, −4, −6 and −8) are close-up images from (−1, −3, −5 and −7), respectively. Scale bars: 10 μm in (−1, −3, −5, −7) and 5 μm in (−2, −4, −6, −8). (C) Agrobacterium-mediated transient expression of GFP + GSF-TM and ER + RFP in the epidermal cells of N. benthamiana. The GFP + GSF-TM fusion protein (−3, −4) that accumulated in the nucleus (white arrow) was highly similar to the blue DNA-staining (Hoechst) (−1, −2) and different from where ER + RFP was localized (−5, −6). A merged fluorescence image of (−1, −3, −5) in (−7); (−2, −4, −6) in (−8) showing the similar localization of GFP + GSF-TM and blue DNA-staining (Hoechst) (white arrows in −7). (−2, −4, −6 and −8) are close-up images from (−1, −3, −5 and −7), respectively. Scale bars: 10 μm in (−1, −3, −5, −7) and 5 μm in (−2, −4, −6, −8).

