Figure 7.
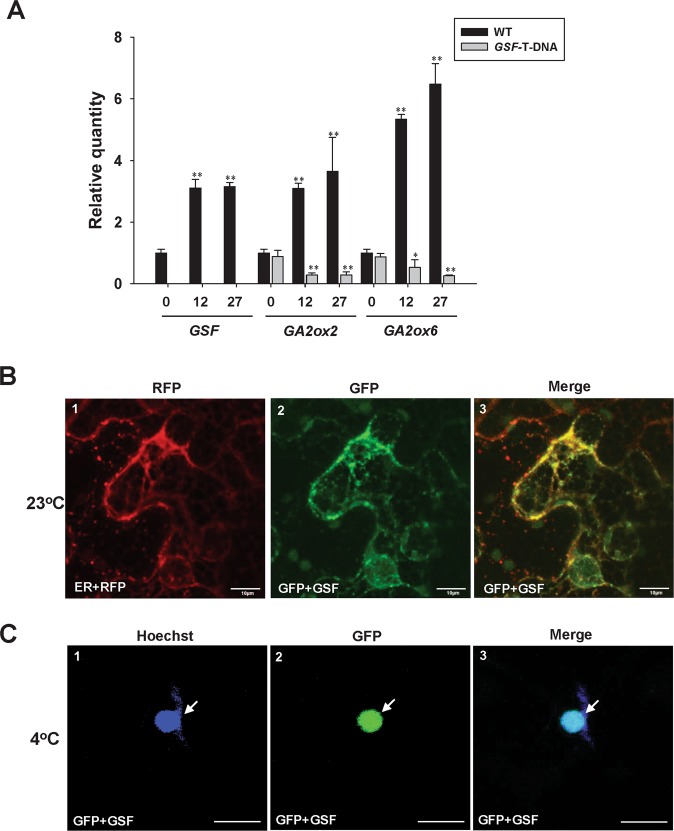
Detection of the expression for GSF and the GA metabolic pathway genes and the cellular localization of GSF under cold treatment. (A) Detection of the expression for GSF, GA2ox2 and GA2ox6 using real-time quantitative RT-PCR for 14-day-old wild-type Arabidopsis and GSF T-DNA mutants (SALK_022174) after exposure to 4 °C over a period of 12 and 27 hours, respectively. For the detection of GSF expression in SALK_022174 mutant, the primers pair F-1 (GSF qRT for-1) and R-1 (GSF qRT rev-1) (Supplementary Table S1), which located in the two sides of the T-DNA insertion (Fig. S6), were used. The expression level relative to wild-type plants is presented. Error bars represent standard deviation. The asterisks indicate a significant difference from the untreated wild type (WT, time 0) value (*P ≤ 0.05, **P ≤ 0.01) by Student’s T-test. (B) Agrobacterium-mediated transient expression of GFP + GSF and ER + RFP in the epidermal cells of N. benthamiana at 23 °C. A GFP + GSF fusion protein (−2) accumulated in the ER where the RFP was localized (−1). A merged fluorescence image of (−1, −2) in (−3) showing the similar localization of GFP + GSF and ER + RFP. Scale bars: 10 μm. (C) Agrobacterium-mediated transient expression of GFP + GSF in the epidermal cells of N. benthamiana at 23 °C for 2 days and exposed at 4 °C (cold stress) for 6 hours. GFP + GSF fusion protein (−2) accumulated in the nucleus (arrow) where blue DNA-staining by Hoechst (arrow) was localized (−1). A merged fluorescence image of (−1, −2) in (−3) showing the similar localization (arrow) of GFP + GSF and blue DNA-staining (Hoechst). Scale bars: 10 μm.

