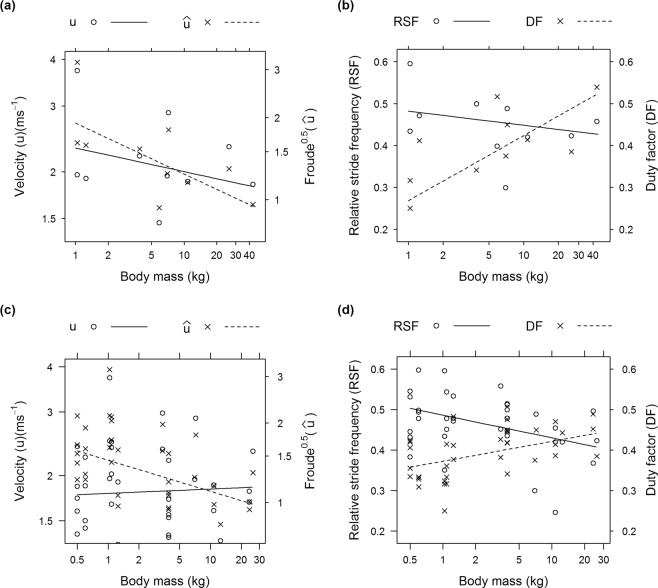
Figure 2.
Bivariate plots from analyses using linear mixed effects models (a,b) and linear models (c,d), depicting the relationships of kinematic y-variables with body mass, based on only Crocodyloidea and asymmetrical gait data. (a,b): dataset 3 (fastest running stride per individual); (c,d): dataset 2; all “running” strides (DF < 0.50), accounting for repeated measures per individual. See Table 1 for adjusted means and standard errors of the coefficients.

