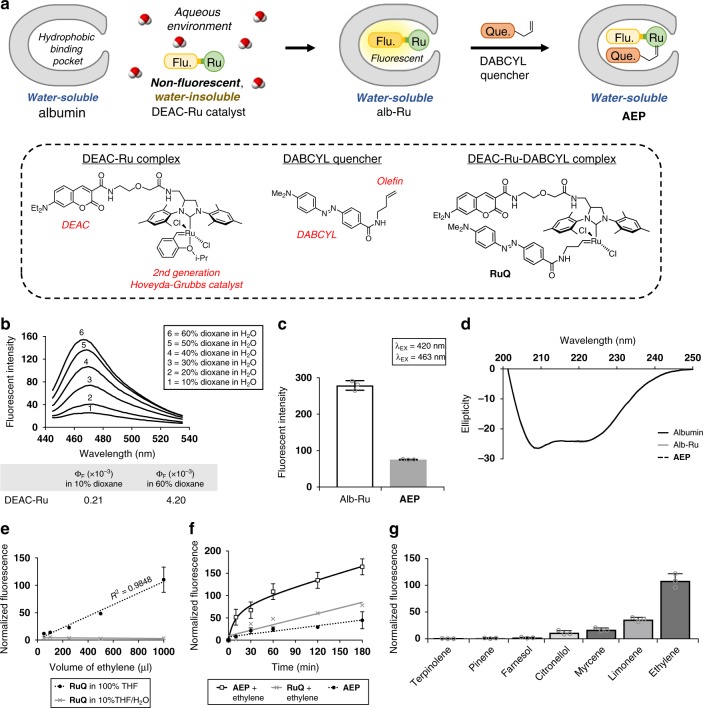
Fig. 2. Preparation and characterization of the AEP probe.
a Depiction of the general steps taken to convert albumin into the ethylene detecting AEP probe. Chemical structures of the DEAC–Ru complex, DABCYL quencher, and RuQ are shown for reference. b Emission spectra and calculated quantum yields of DEAC–Ru under varying concentrations of dioxane in water. c Measured fluorescence of the alb–Ru complex compared to the non-fluorescent AEP probe. d Circular dichroism spectra comparison of the various protein complexes used in this study to investigate changes in structural folding. e Dose-dependent response curves for RuQ exposed to different volumes of ethylene gas under solvent conditions of either 100% THF or 10%THF/H2O. f Time-based monitoring of AEP (100 µM) exposed to a theoretical concentration of 6 mM ethylene dissolved in H2O. g Selectivity study of AEP (100 µM) against various types of terpenes (6 mM). In general, fluorescence studies were performed at λEX = 420 nm/λEM = 463 nm. Error is represented as s.d. of three independent experiments. Source data are provided as a Source Data file.

