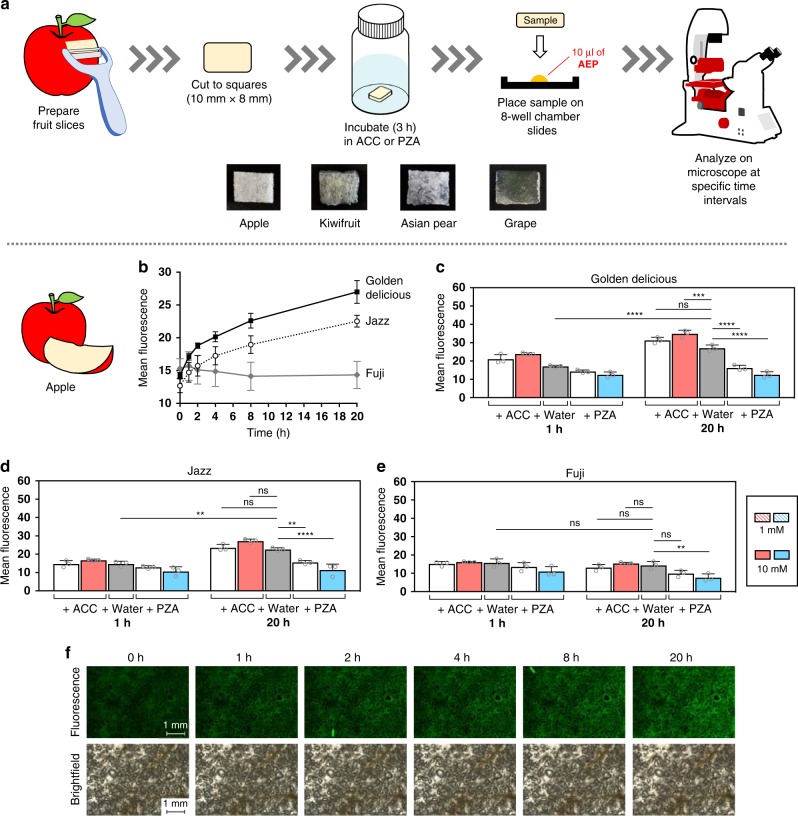
Fig. 5. Time-dependent detection of ethylene in apples.
a In general, samples were prepared from slices of fruit flesh cut into ~10 mm × 8 mm segments. Following a 3 h incubation either in solutions of ACC, PZA, or water (as a control), samples were then removed and placed onto chamber slides preloaded with AEP probe (10 µl of a 400 µM solution). Using an inverted microscope, samples were monitored at specific time intervals. To examine the difference in ethylene production across different apple cultivars, fluorescence was monitored over time for Golden Delicious, Jazz, and Fuji apples b. A summary and statistical comparison between the 1 and 20 h timepoints for each apple cultivar are also shown c–e, as well as samples images of Golden Delicious apples (water-control) over various timepoints f. Statistical analysis was performed using a one-way ANOVA with Tukey’s multiple comparisons test. *P < 0.03, **P < 0.002, ***P < 0.0002, ****P < 0.0001, ns = not significant. Error is represented as s.d. of three independent experiments. Source data are provided as a Source Data file.

