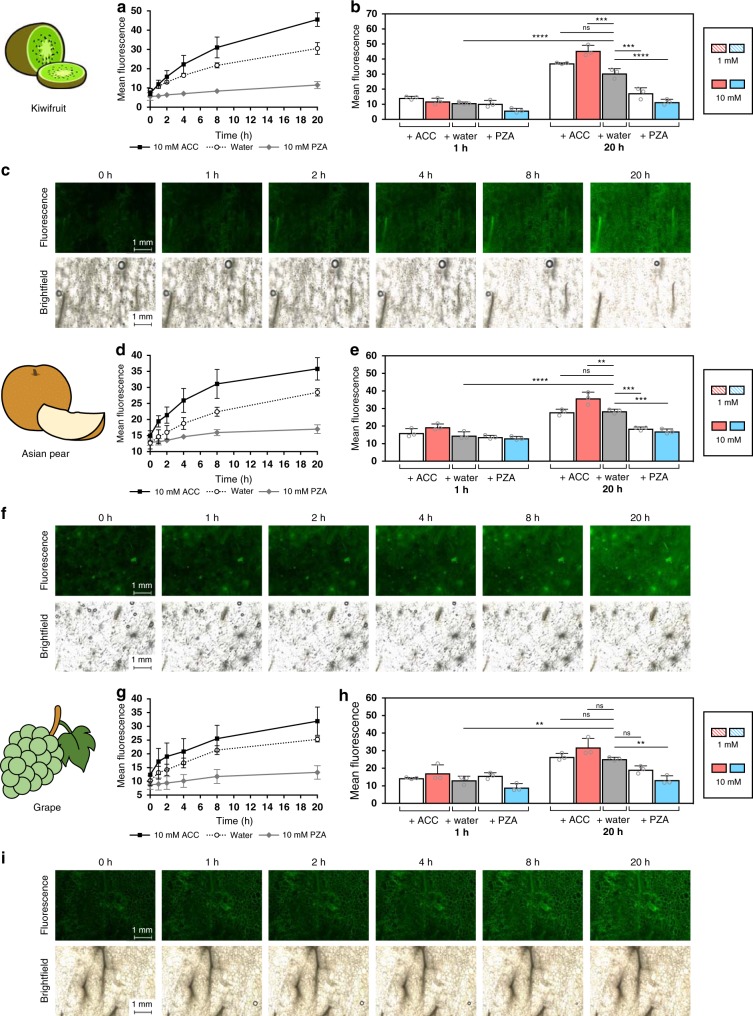
Fig. 6. Time-dependent detection of ethylene in other ethylene-producing fruits.
Fluorescence was monitored over time under various conditions (ACC or PZA) for kiwifruit a, Asian pear d, and Muscat grapes g. A summary and statistical comparison between the 1 and 20 h timepoints for each fruit are shown b, e, h, as well as samples images (water-control) over various timepoints c, f, i. Statistical analysis was performed using a one-way ANOVA with Tukey’s multiple comparisons test. *P < 0.03, **P < 0.002, ***P < 0.0002, ****P < 0.0001, ns = not significant. Error is represented as s.d. of three independent experiments. Source data are provided as a Source Data file.

