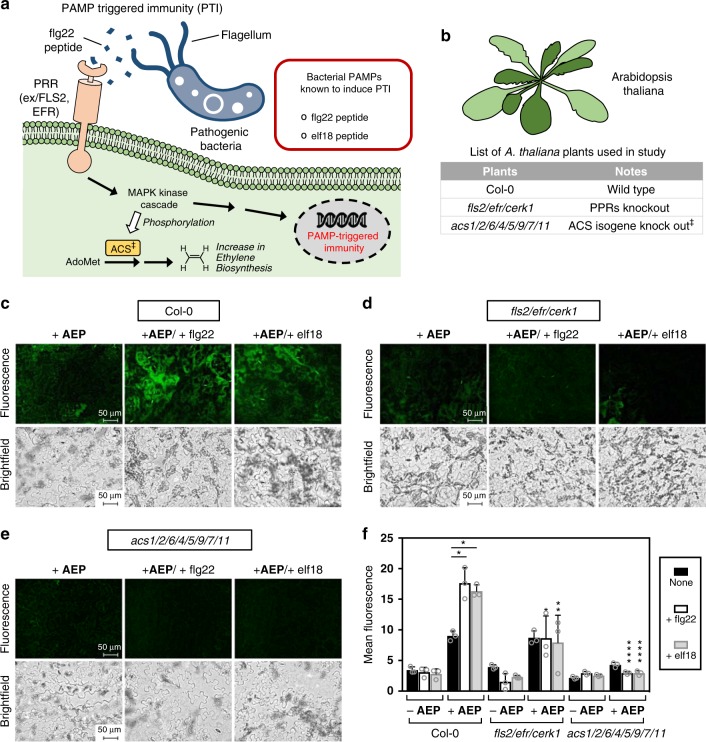
Fig. 8. Detection of ethylene produced as a result of PAMP-triggered immunity in A. thaliana plants.
a Depiction of the general pathway that leads to PTI response. b List of A. thaliana plants used in this experiment. Fluorescence and brightfield imaging (×40 magnification) of epidermal peels applied with AEP (100 µM) for wild-type Col-0 c, PRR-deficient fls2/efr/cerk1 d, and the ethylene biosynthesis defected acs1/2/6/4/5/9/7/11 e. Additionally, supplementation studies were performed using the PAMPs, flg22, and elf18 (4.8 µM), which were applied to all plants. f Summary of the measured fluorescence between the various conditions studied. Statistical analysis was performed using a one-way ANOVA with Tukey’s multiple comparisons test. If not indicated, comparisons were made between the mutants and wild-type under the same treatment conditions. *P < 0.03, **P < 0.002, ***P < 0.0002, ****P < 0.0001, ns = not significant. Error is represented as s.d. of three independent experiments. Source data are provided as a Source Data file.

