Figure 1.
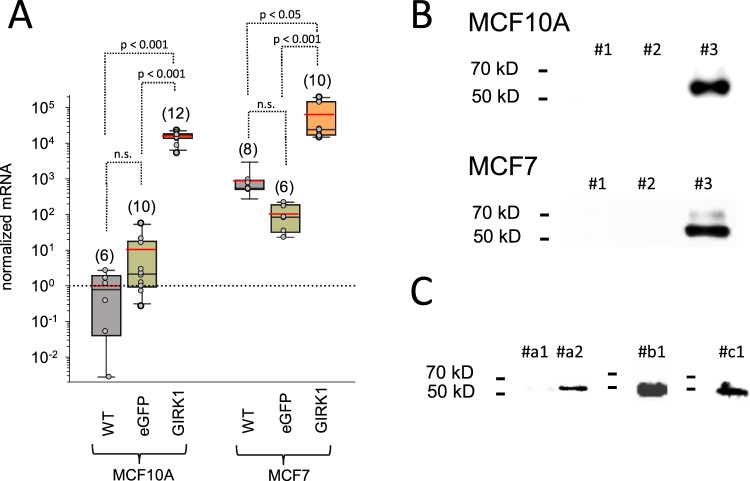
Quantification of GIRK1 mRNA and protein in the different cell lines. (A) GIRK1 mRNA levels normalized to MCF10AWT. WT, eGFP and GIRK1 denote wildtype, eGFP (control) and GIRK1 overexpressors, respectively. The median value is represented by the black line within the box, box margins represent 75% and 25% percentiles, whiskers indicate 90% and 10% percentiles. The red line represents the mean value. Individual values are shown as grey circles. The number of individual experiments is given in parenthesis above each box. Statistically significant differences between groups are indicated above brackets (n.s.: statistically not significant). (B) WB analysis of cell lysates: upper panel: MCF10A lysates (3 µg protein per slot was applied) probed with GIRK1CT Ab. #1: MCF10AWT, #2: MCF10AeGFP and #3: MCF10AGIRK1. Lower panel: MCF7 lysates (3 µg protein per slot) probed with GIRK1CT Ab. #1: MCF7WT, #2: MCF7eGFP and #3: MCF7GIRK1. (C)WB analysis of immunoprecipitates derived using GIRK1CT Ab on MCF7WT cell lysates. Left: membrane probed using GIRK1CT Ab. #a1: lysate (30 µl), #a2: IP (30 µl). Middle: #b1: IP (30 µl) membrane probed using GIRK1NT Ab (N-terminal) Ab. Right: #c1: IP (30 µl). Membrane probed using monoclonal GIRK1 Ab.

