Figure 10.
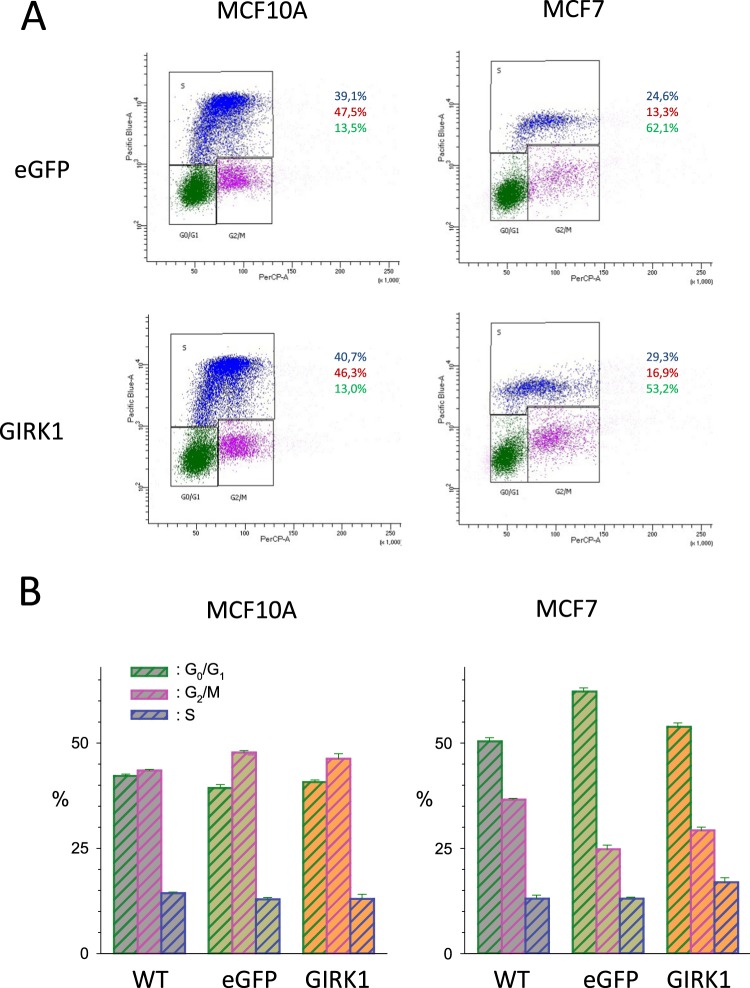
Proliferation of MEC lines in cell culture. (A) Representative original results from cell cycle assessment by gated cell sorting according to fluorescence intensities (x-axis: PerCP-A; y-axis: PacificBlue). Left: MCF10AeGFP (top) and MCF10GIRK1 (bottom). Right: MCF7eGFP (top) and MCF7GIRK1 (bottom). Individual cells (represented as dots), attributed to a particular phase of the cell cycle are surrounded by black line (green dots: G0/G1 phase; purple dots: G2/M phase and blue dots: S phase). (B) Statistical analysis of the percentage of time spend at different stages of the cell cycle. Left: MCF10AWT, MCF10AeGFP and MCF10AGIRK1. Right: MCF7WT, MCF7eGFP and MCF7GIRK1. The differences between WT, eGFP and GIRK1 do not differ statistically significant for either MCF10A nor MCF7.

