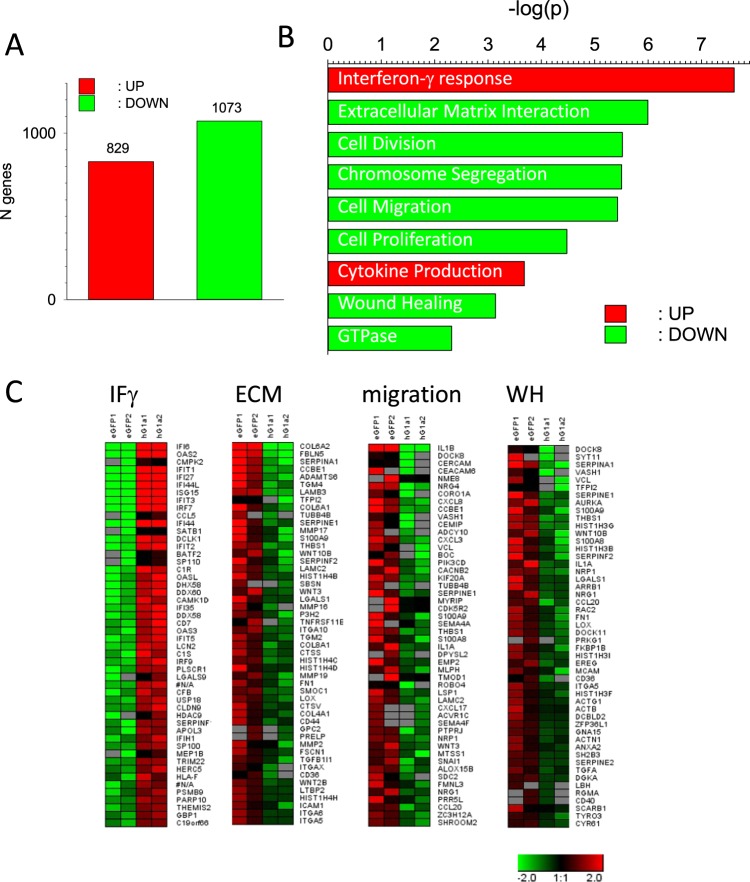
Figure 3.
Effect of GIRK1 overexpression on transcriptome of MCF10A cells. Number of significantly up- or downregulated transcripts when MCF10AeGFP are compared to MCF10AGIRK1. Red: upregulated transcripts, green: downregulated transcripts. (A) Top nine gene ontology clusters derived by DAVID functional clustering. (B) Heat maps displaying the fold changes of expression levels of the top 50 genes of selected GO terms. IF γ: Interferon-γ response. ECM: extracellular matrix interaction. Migration: cell migration and WH: wound healing. Bottom right: color coding for the log2 fold change.

