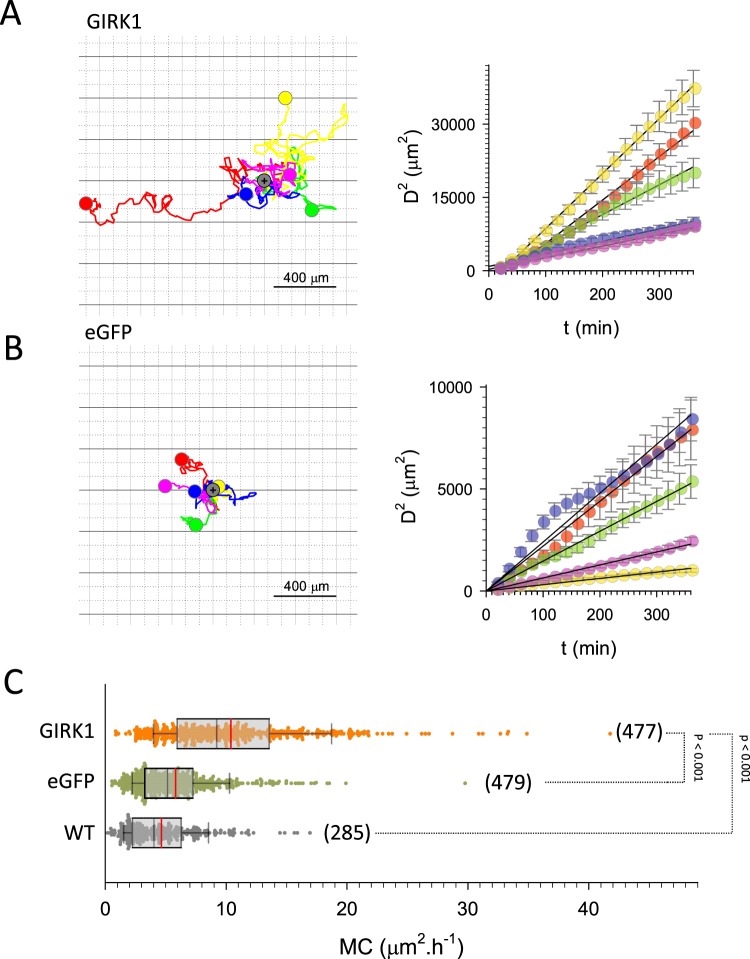
Figure 4.
Cellular migration of MCF10A cells. (A) Migration of 5 selected MCF10AGIRK1 cells over the entire observation interval. Left: flower plots showing cellular trajectories. Starting position of each individual cell was set to the same position, indicated by grey circle. Colored circle indicates the positon of a cell after 72 h. Right: squared distance as a function of time for the five cells shown to the left (circles; bars indicate standard error). Lines represent linear fits through the data. (B) Same as (A), but MCF10AeGFP. (C) Statistical analysis of motility coefficients derived from the different experimental groups. WT: MCF10AWT, eGFP: MCF10AeGFP and GIRK1: MCF10AGIRK1. The median value is represented by the black line within the box, box margins represent 75% and 25% percentiles, whiskers indicate 90% and 10% percentiles. The red line represents the mean value. Individual values are shown as dots. The number of individual cells is given in parenthesis besides each box. Statistically significant differences between groups are indicated by brackets.

