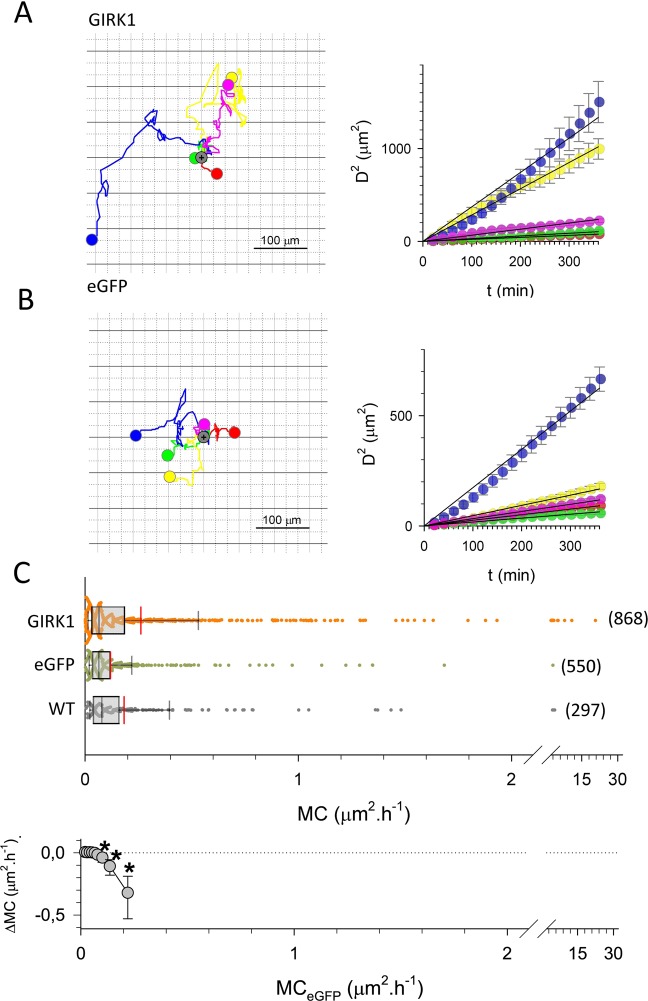
Figure 6.
Cellular migration of MCF7 cells. (A) Migration of 5 selected MCF7GIRK1 cells over the entire observation interval. Left: flower plots showing cellular trajectories. Starting position of each individual cell was set to the same position, indicated by grey circle. Colored circle indicates the positon of a cell after 72 h. Right: squared distance as a function of time for the five cells shown to the left (circles; bars indicate standard error). Lines represent linear fits through the data.(B) Same as (A), but MCF7eGFP. (C) Statistical analysis of motility coefficients derived from the different experimental groups. Top: WT: MCF7WT, eGFP: MCF7eGFP and GIRK1: MCF7GIRK1. The median value is represented by the black line within the box, box margins represent 75% and 25% percentiles, whiskers indicate 90% and 10% percentiles. The red line represents the mean value. Individual values are shown as dots. The number of individual cells is given in parenthesis besides each box. Bottom: Difference in MCs (ΔMC = MCeGFP-MCGIRK1) calculated for 10% percentile intervals vs. MCeGFP. Whiskers represent 95% confidence intervals. *The average MCs of the 70%, 80% and 90% percentile differs statistically significant between MCF7eGFP and MCF7GIRK1.

