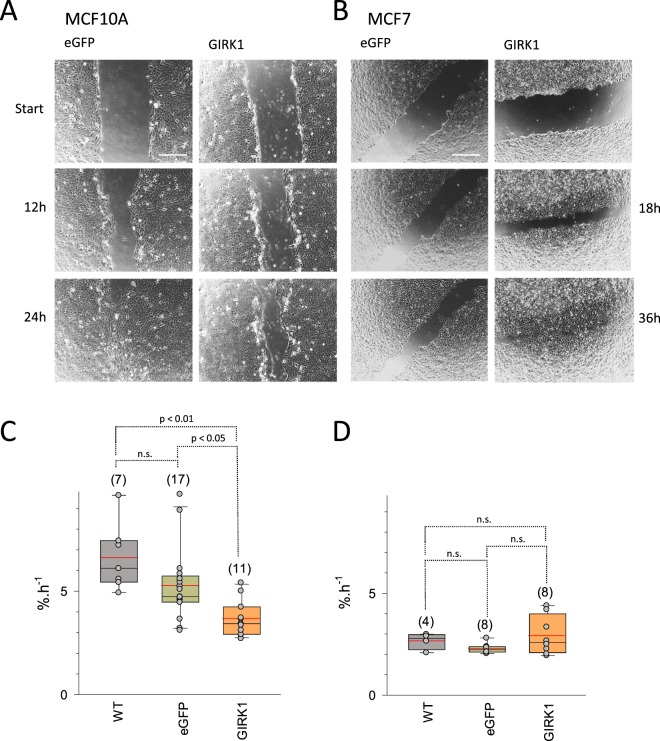
Figure 8.
Wound healing rates in the different MEC lines. (A) Representative frames recorded at different time points during the wound healing process. eGFP: MCF10AeGFP and GIRK1: MCF10AGIRK1. (B) Similar to (A), but MCF7. (C) Statistical analysis of wound healing rates of MCF10A cells. WT: MCF10AWT, eGFP: MCF10AeGFP and GIRK1: MCF10AGIRK1. The median value is represented by the black line within the box, box margins represent 75% and 25% percentiles, whiskers indicate 90% and 10% percentiles. The red line represents the mean value. Individual values are shown as grey circles. The number of individual experiments is given in parenthesis above each box. Statistically significant differences between groups are indicated above brackets (n.s.: statistically not significant). (D) Same as (C), but MCF7 cells.

