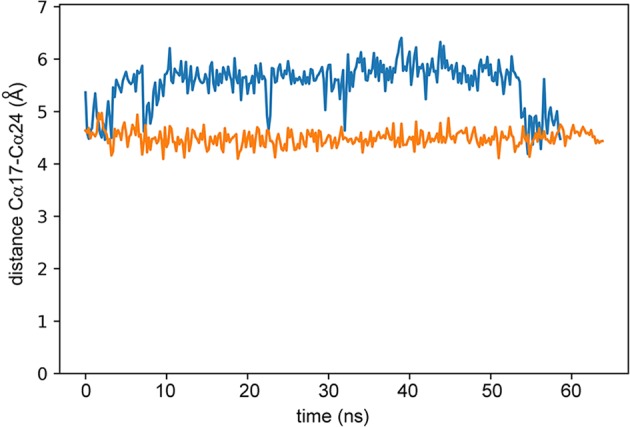
Figure 4.

The distance between Cα of Cys17 and Cα of Arg24, in an enhanced sampling molecular dynamics trajectory in which each iteration represents 0.2 ns. The blue line is for a negative Cys17-Cys32 χ3, as in the crystal structure, while the orange line is for a positive χ3. The downward excursions of the distance (eg at 22.6 ns for the negative angle) are due to changes in the position of the disulfide, rather than a change in the chirality of the angle.
