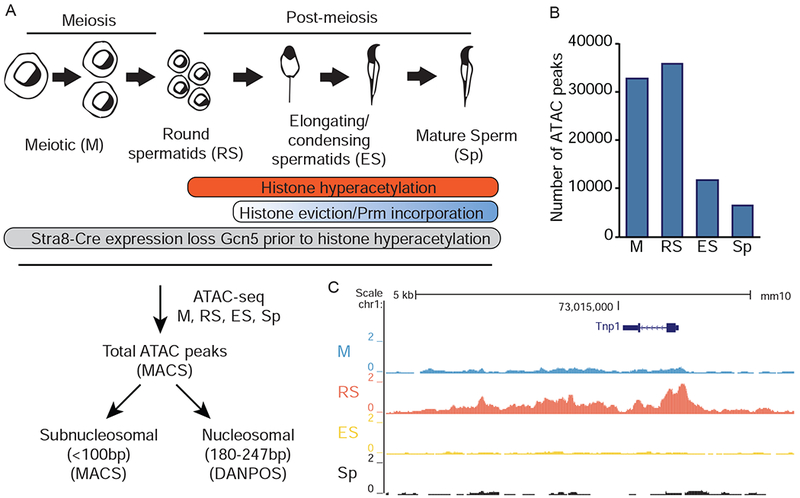
Figure 1.

Assessment of chromatin dynamics during spermiogenesis by ATAC-seq. A) Schematic representation (top) of spermiogenesis beginning with meiotic spermatocytes (M) and progressing through round spermatid (RS), elongating/condensing spermatid (ES), and sperm (Sp). (Bottom) Experimental and computational pipeline for ATAC-seq experiments. B) Total ATAC-seq peaks in SV129 germ cells called by MACS peak calling algorithm. C) Representative UCSC Genome Browser tracks of total ATAC-seq signal at Tnp1 locus. See also Figure S1.
